Area chart
The area chart, which is formed on the basis of the line chart, fills the area between the line of the line and the argument axis in the line chart with color or texture, and the color fill can better highlight the trend information.
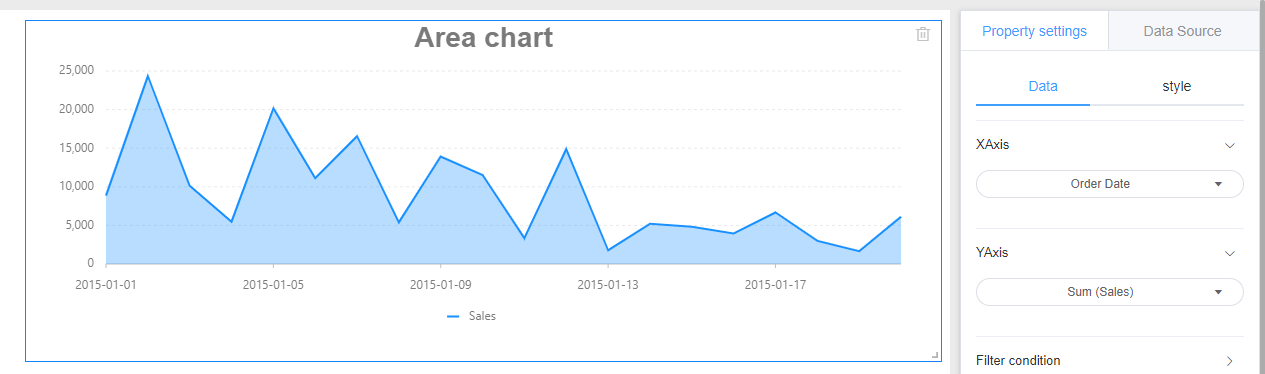
1. Create
Click on Charts -> Area chart to draw a bar chart on the canvas.
2. Data settings
Referring line chart data provided
3. Style settings
The Area chart style is divided into three parts: background, title, and drawing area.
Referring specifically set line graph style setting the corresponding module.
4. Location and size
Referring line chart setting position and size