Simple and fast
InsightsHolic can help you and your team quickly perform data visualization analysis in just a few minutes, presenting reports and sharing them with others

InsightsHolic can help you and your team quickly perform data visualization analysis in just a few minutes, presenting reports and sharing them with others

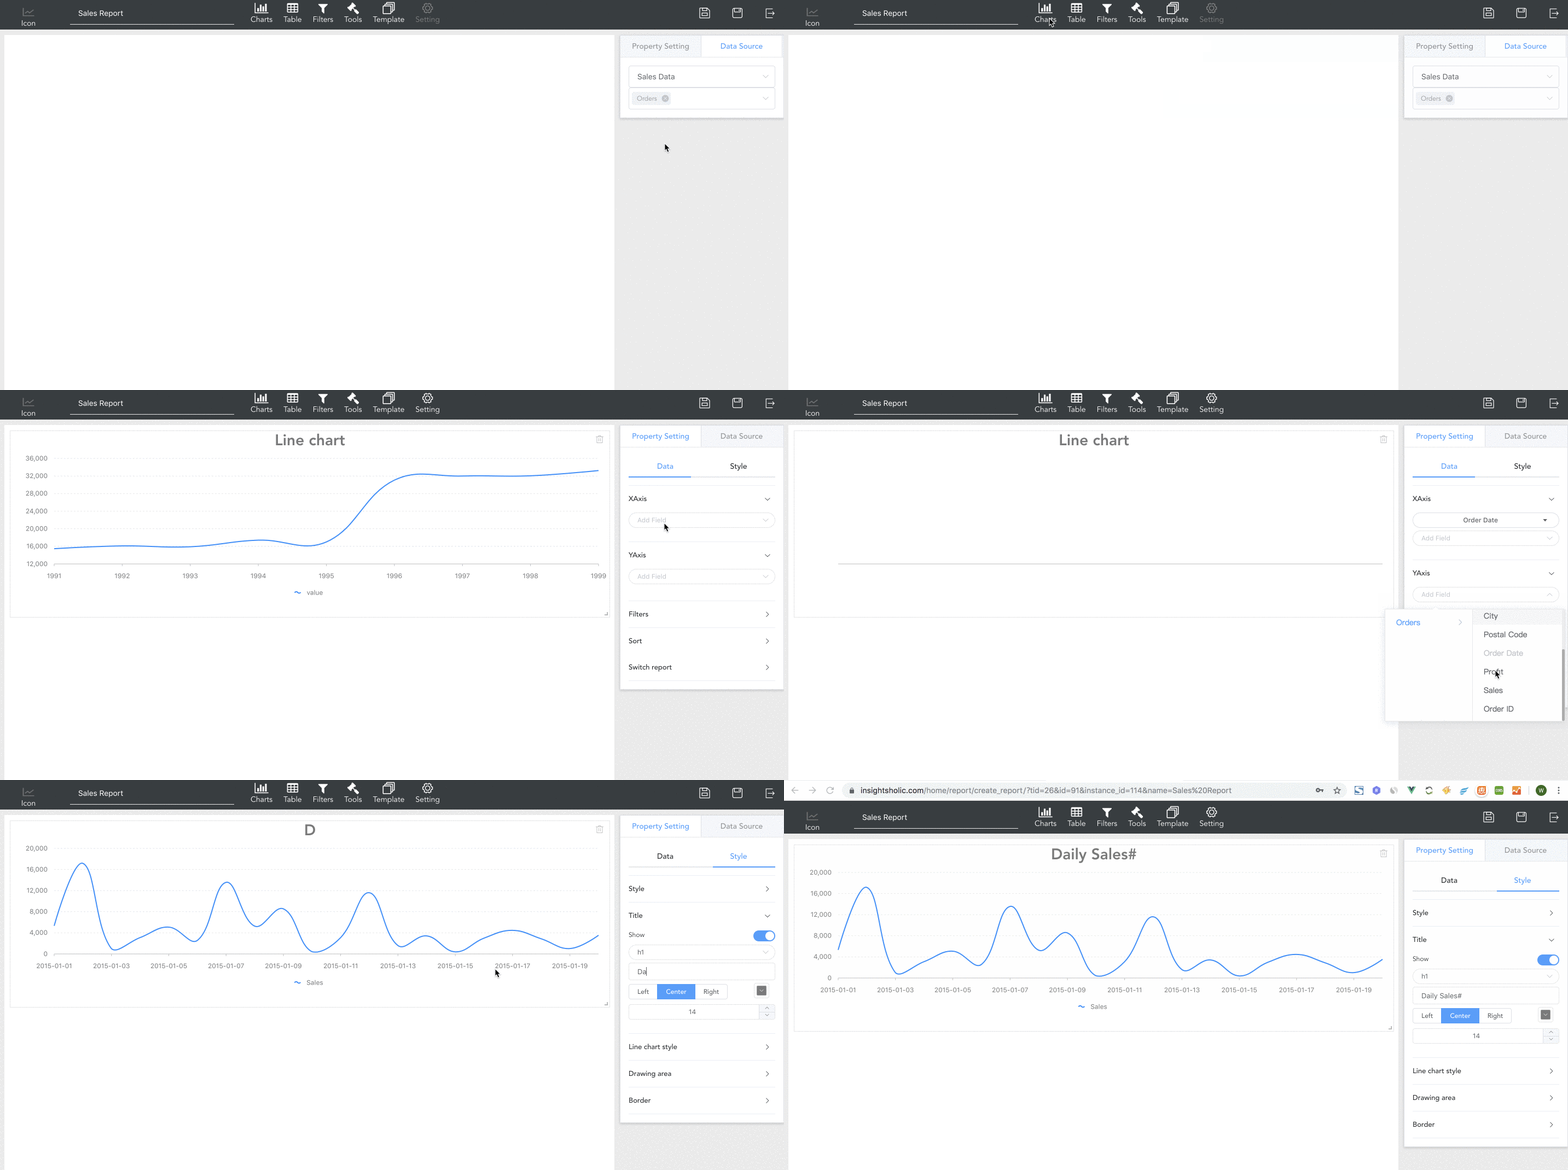
It’s very easy to create reports in InsightsHolic, you just need to drag the relevant report elements to quickly display the report in real time.
All reports have the flexibility to set access rights, and you can set up reports as public reports, such as industry reports, which are visible to all Internet users. You can also set the report to be private and share the report to anyone
You can create a report template, and other users can generate data reports immediately by providing the same data format.
