Introduction to InsightsHolic
InsightsHolic is an online Web Visual Report Generation Tool (IH) that allows users to quickly create reports and share them with others in a few simple steps.
1. Connect to the data source
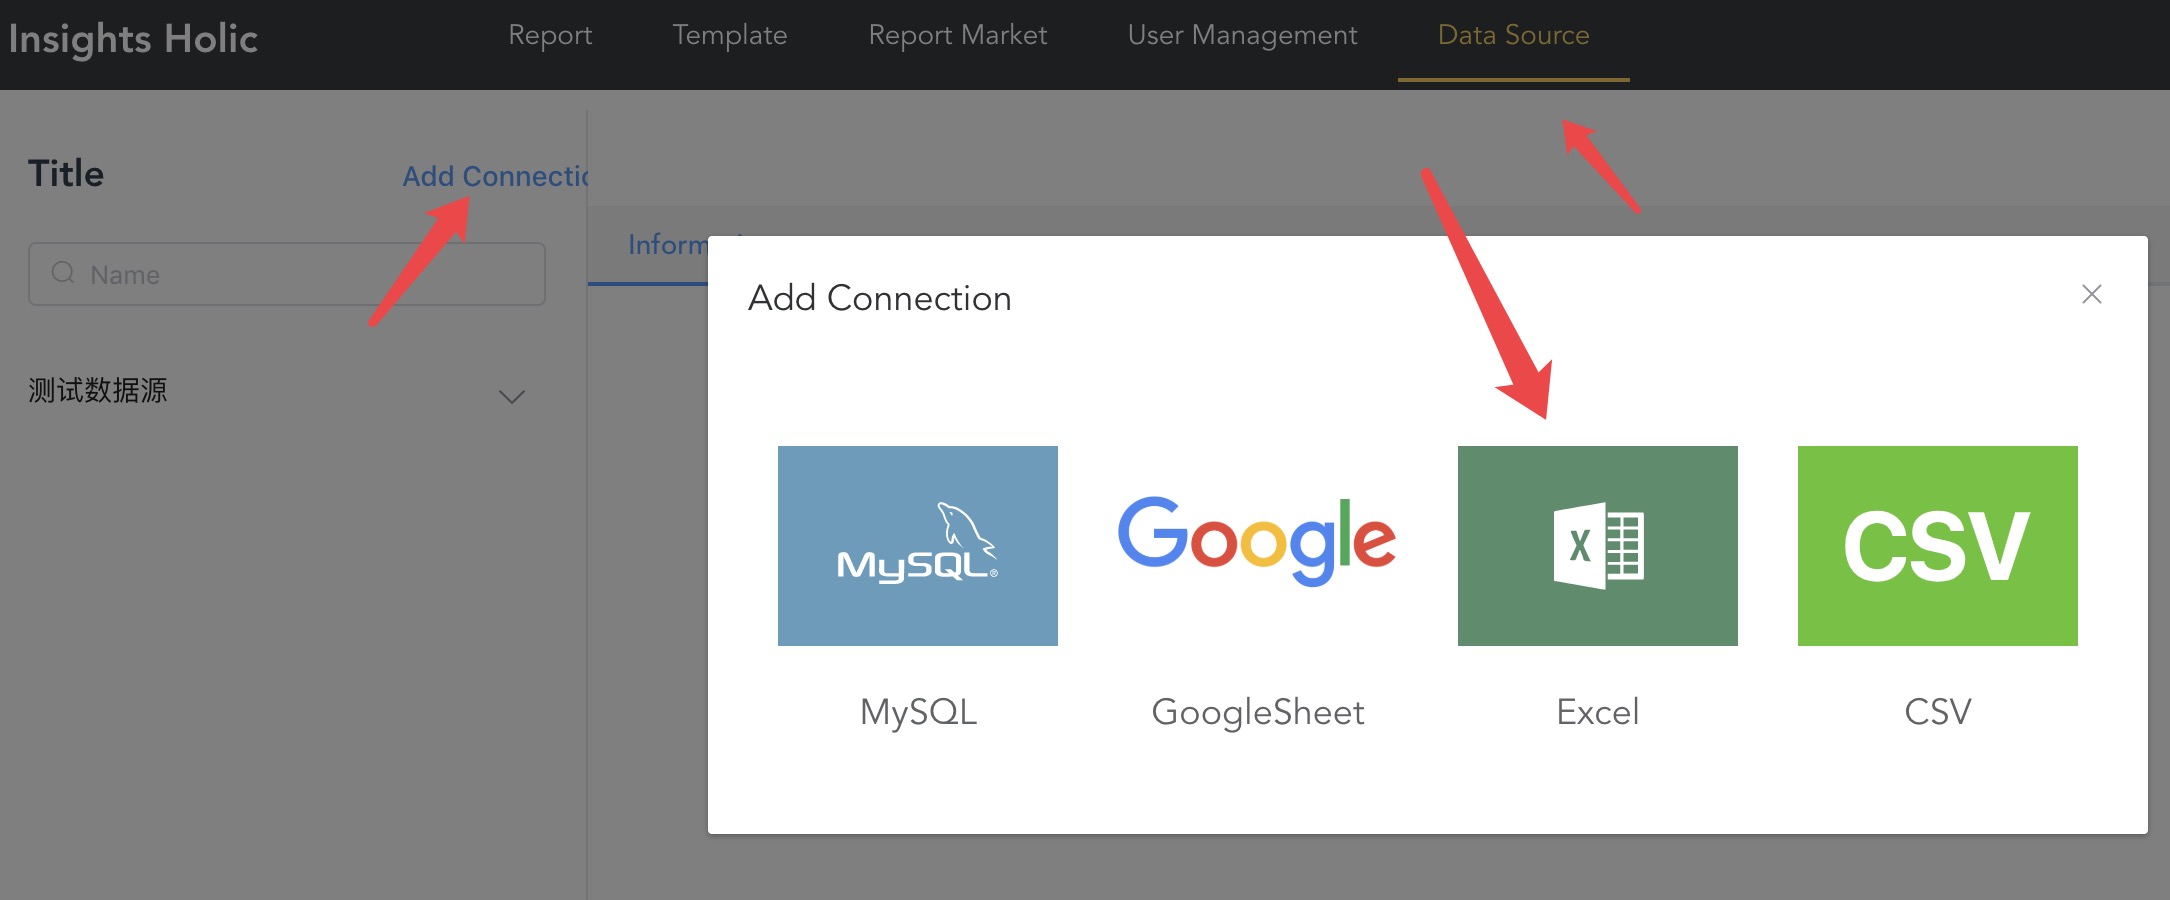
1. Log in to the system, select the data source, click Add Data Source, select the type of data you want to connect to (Excel, CSV, Mysql, GoogleSheets), etc. Here we use Excel as an example.
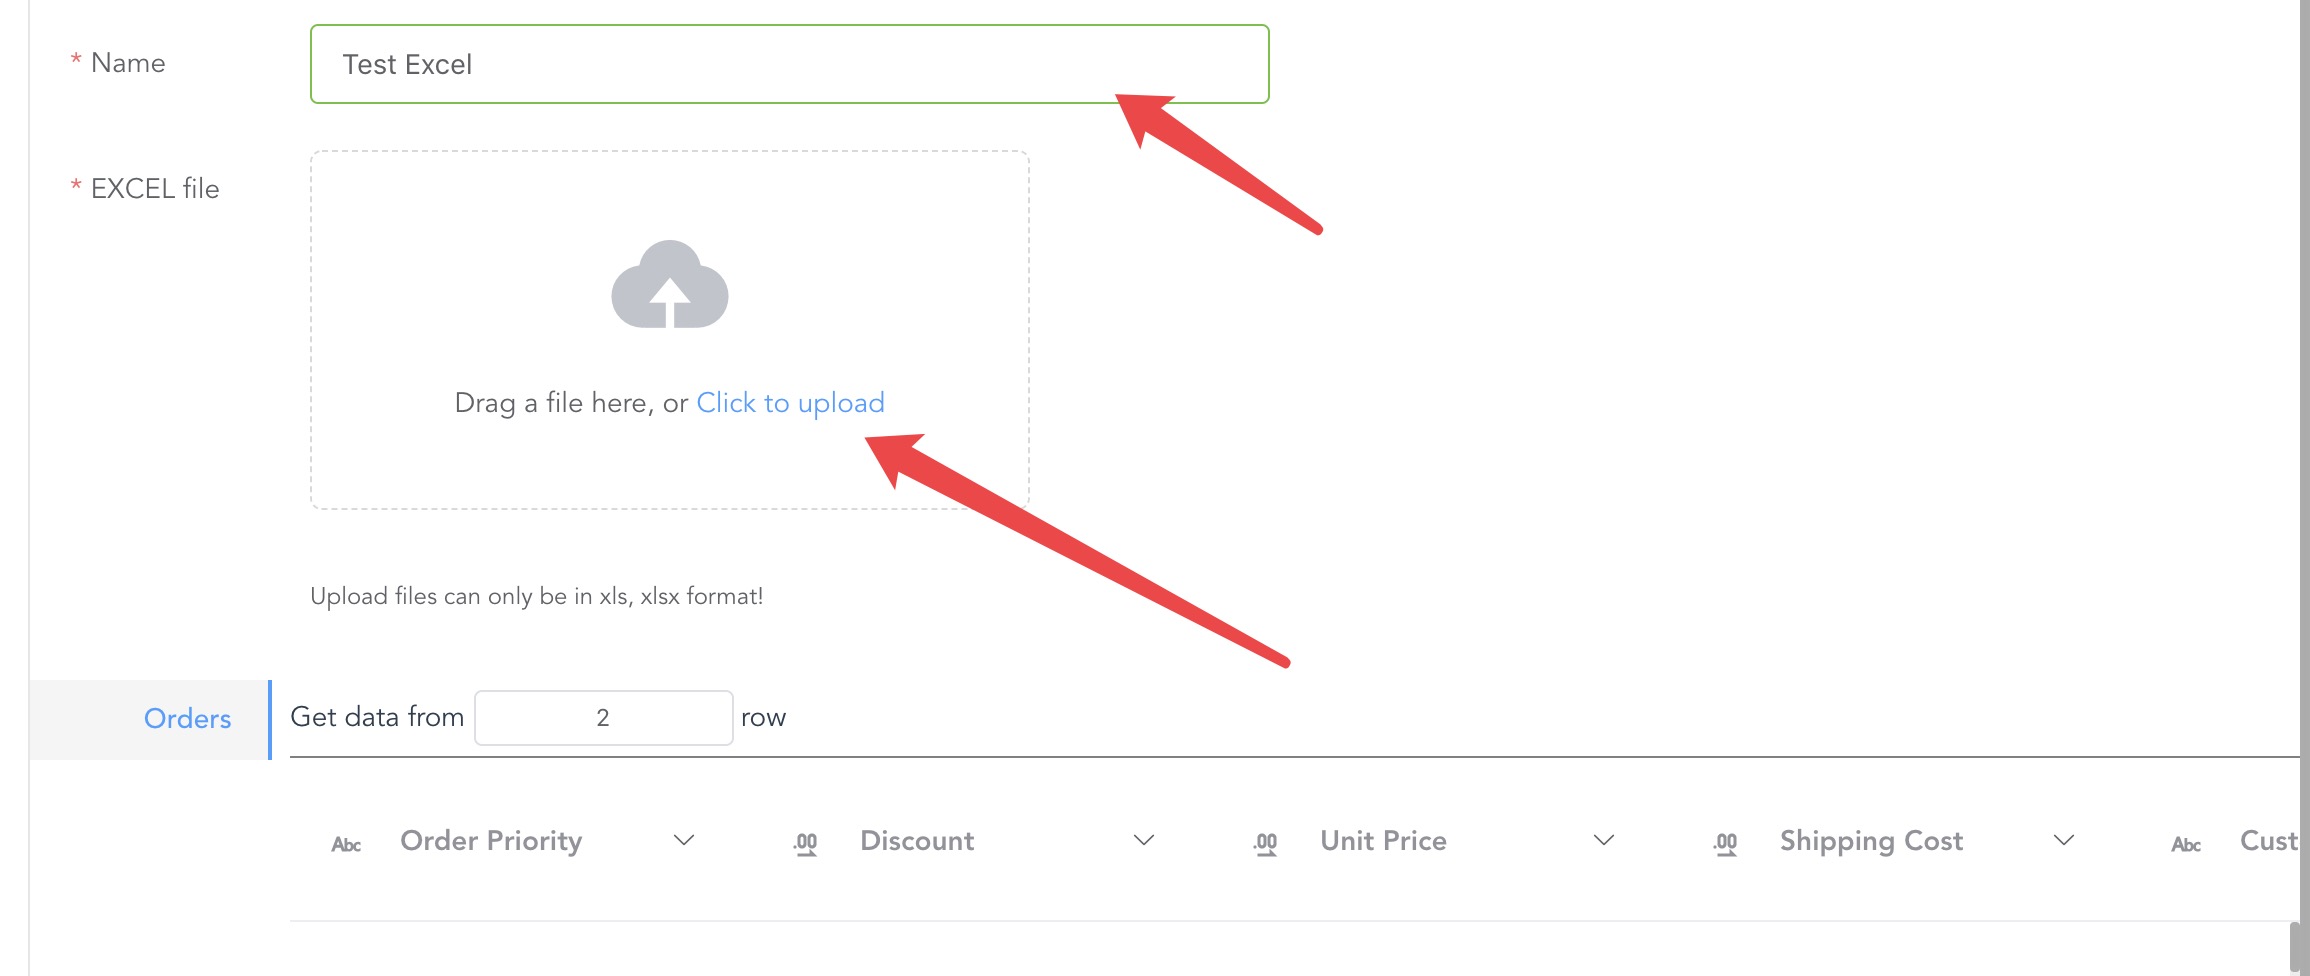
2. Enter the data source name and upload the Excel form. The system will automatically read the contents of the form and display it. Save it after confirmation.
3. At this point, the data source is added.
2. Create a report
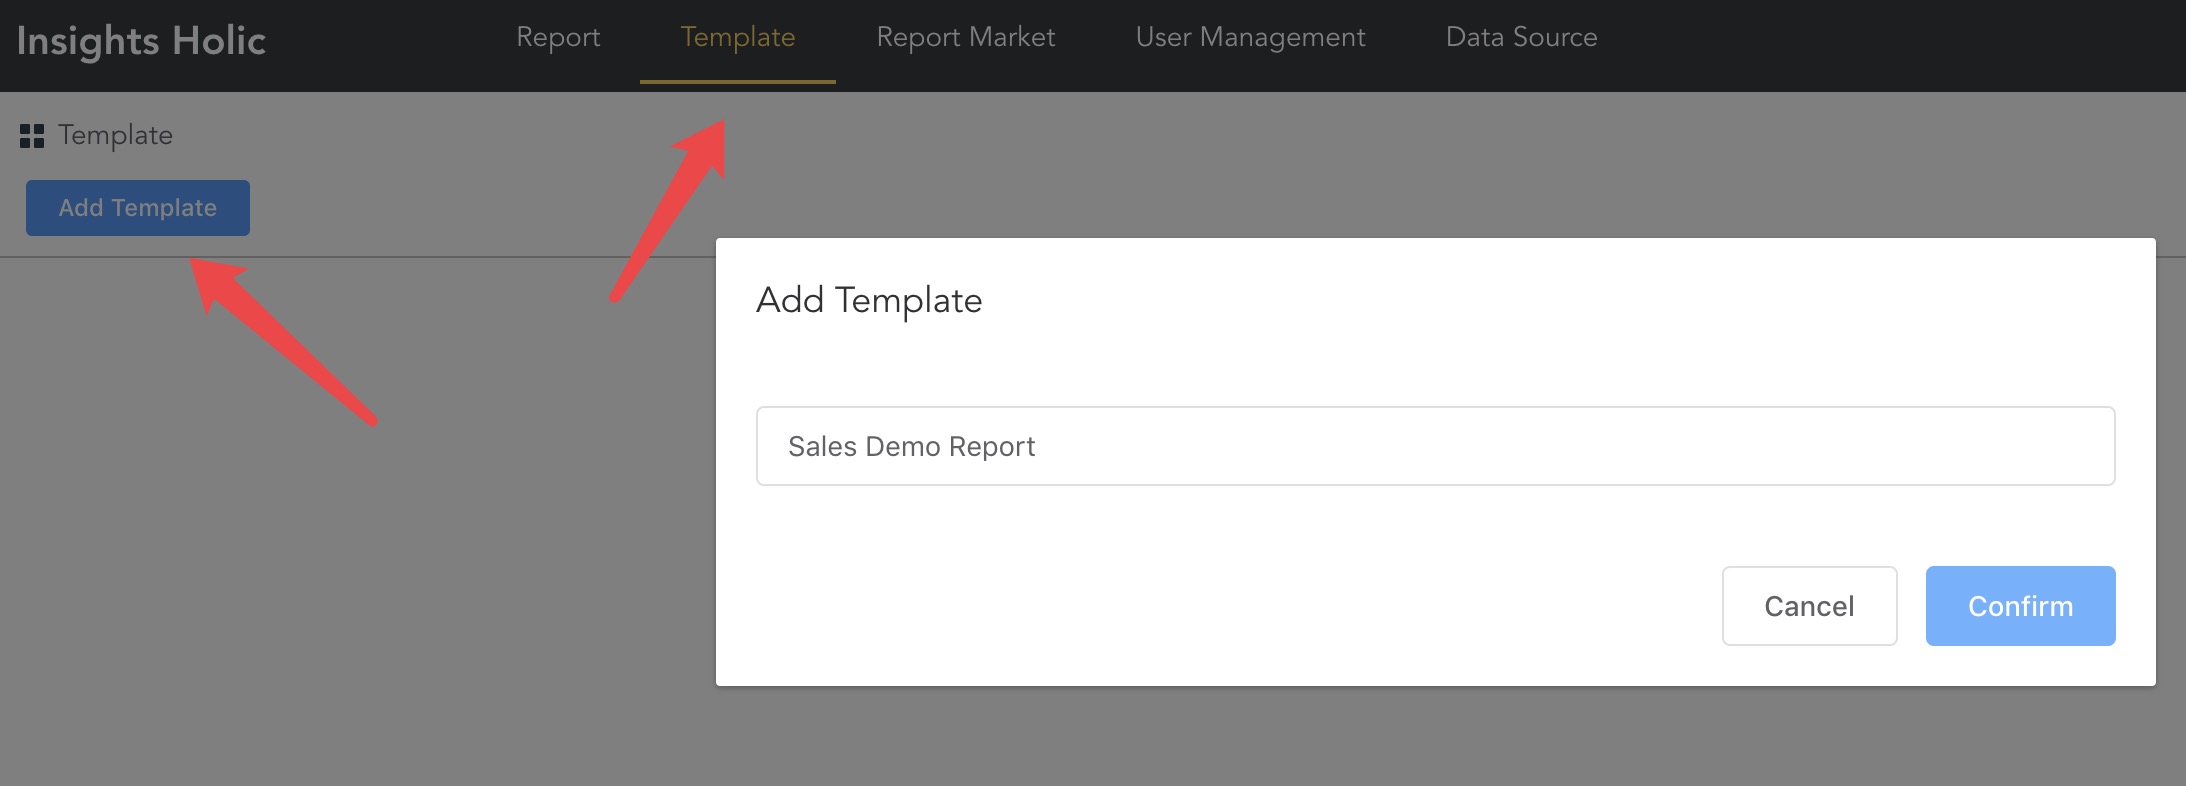
1. Click Report Template -> Add Template to enter the report template name
2. Click on the Create Report page. IH organizes your report conveniently in the form of a folder.
3. After creating the report page, enter the report configuration page.
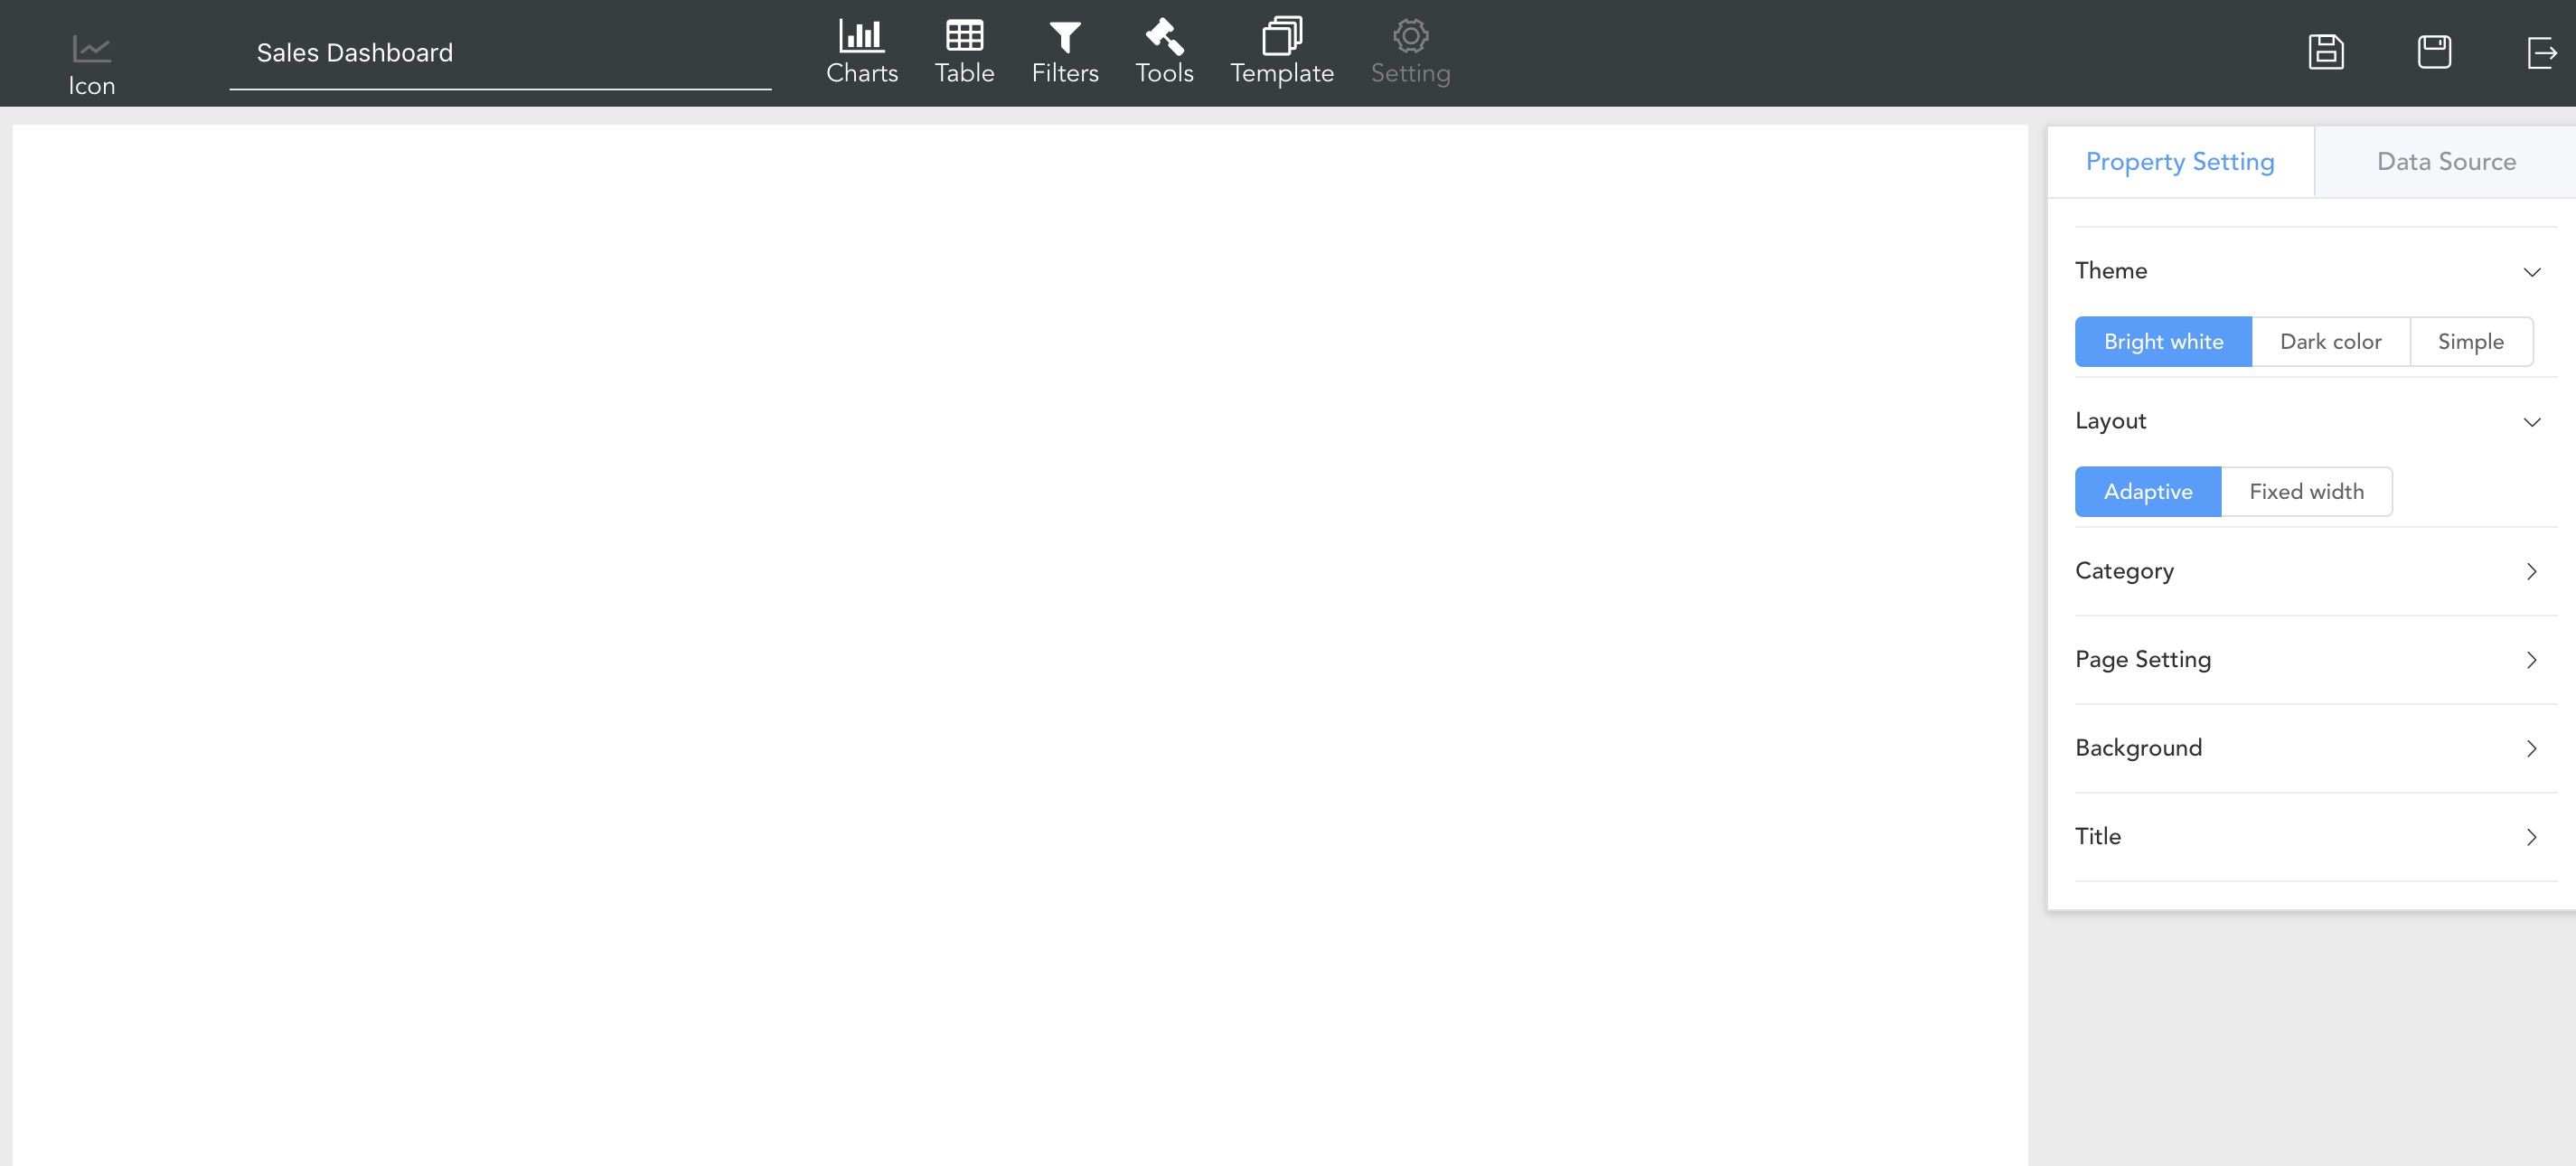
4. Select data source and data table

5. Drag the line chart to the canvas and set the X and Y axis data of the line chart. At this point, we will configure the line chart.

6. Save the report
3. Publish and share reports
The report created by default can only be seen by itself. If you want other users to access the report, we need to publish the report. The published report will appear in the report bar.
1. Click on the template's publish icon
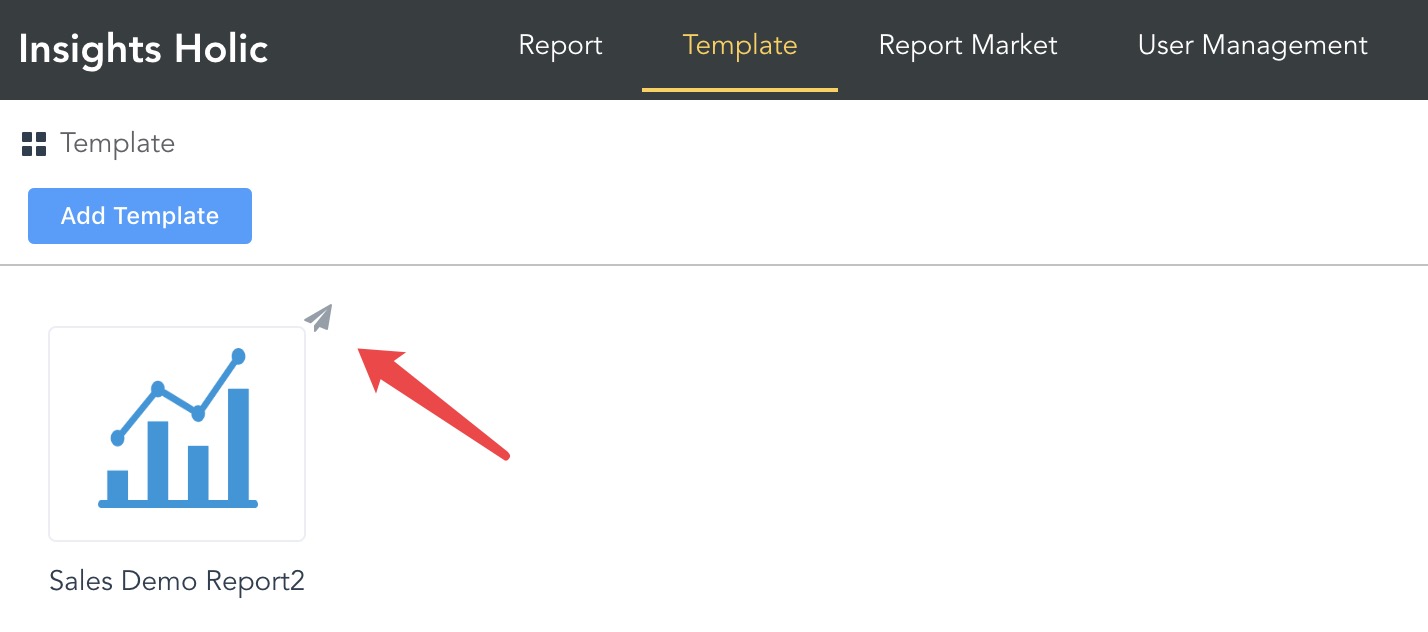
2. Fill in the relevant properties of the report template
- Whether to expose the template: Select Yes, the template will go to the report store and anyone can install it. Choose No, just use it yourself
- Whether to expose the instance: Select Yes, all users can view the report through the URL. If you choose No, you need to obtain an authorization to view
3. Share the report
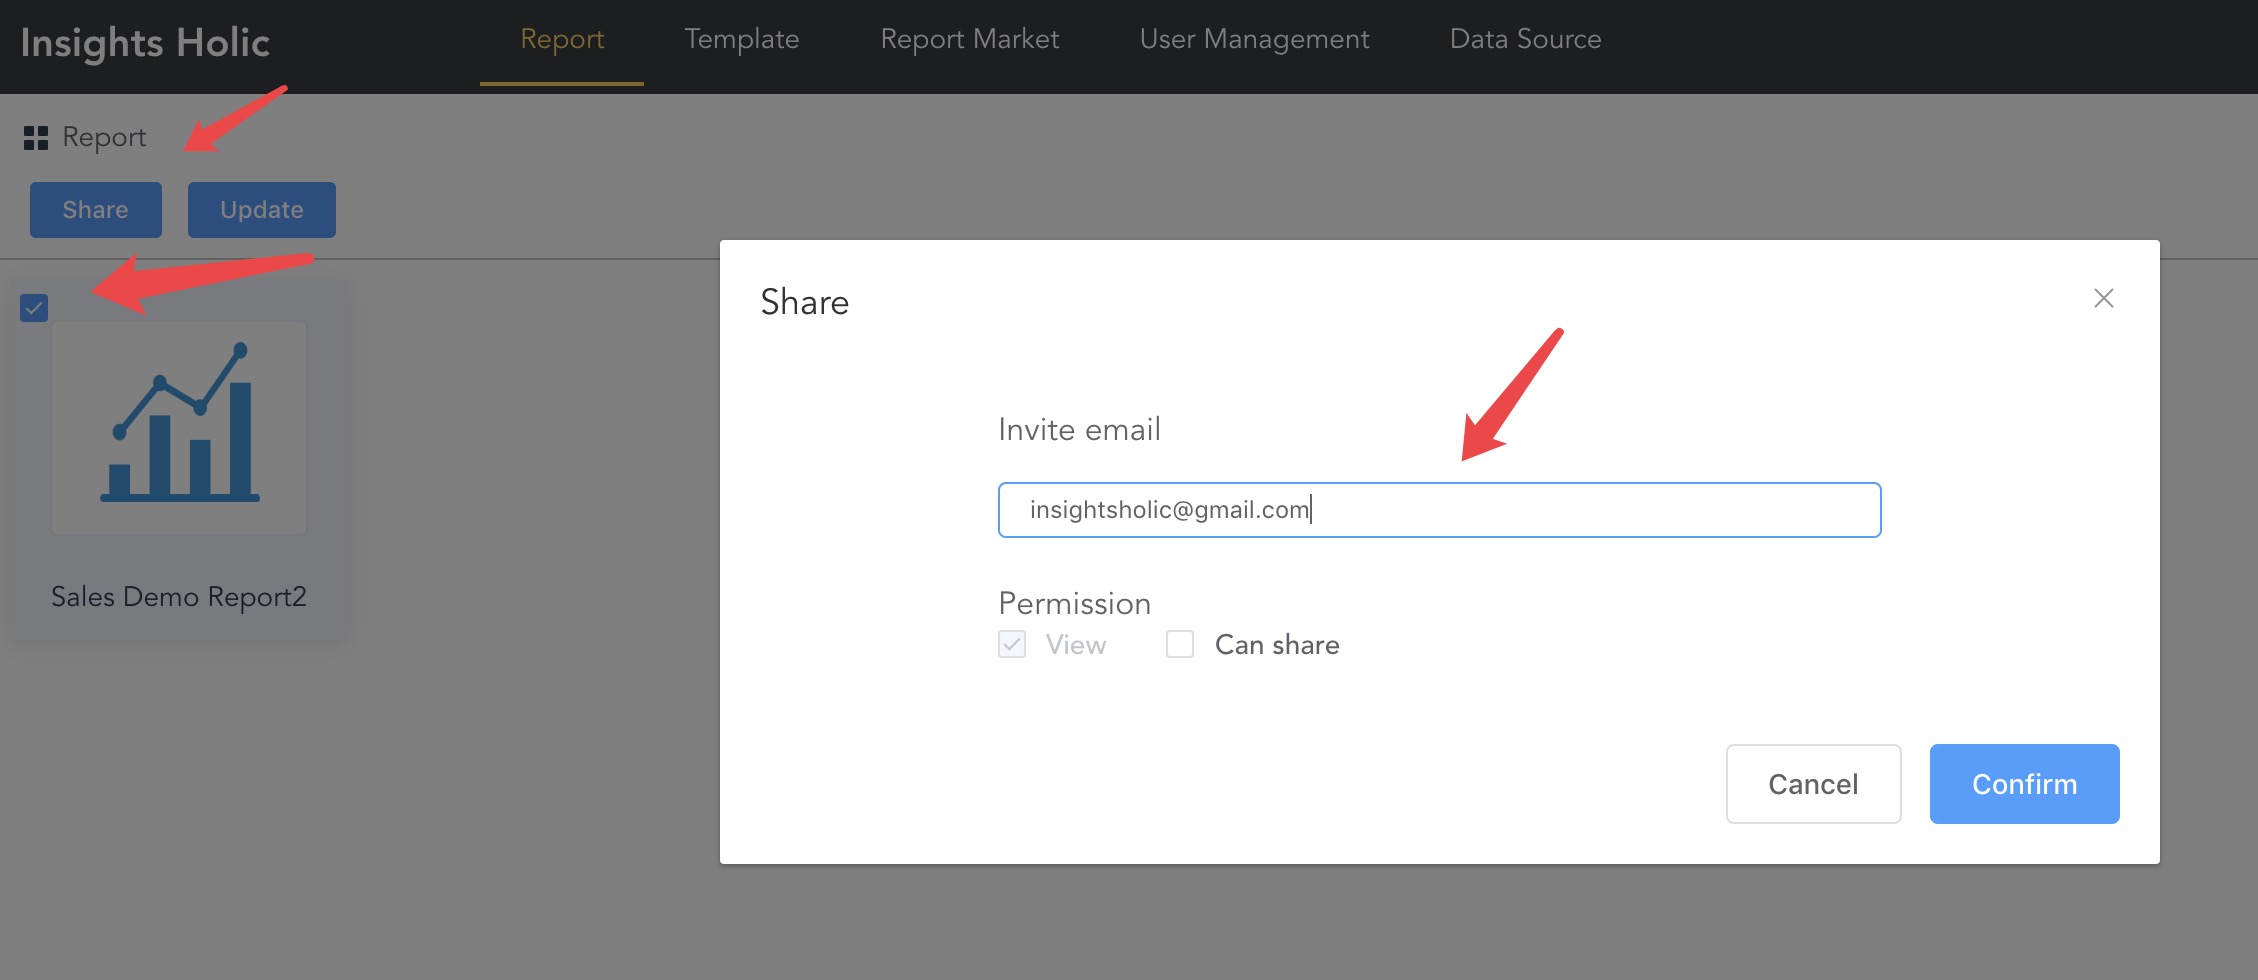
Check the report you want to share, click the Share button, and enter the shared user email. IH will send a notification email to the email address, and the user can view the shared report after registering the account.
