Table
Table are a visual communication model that organizes data efficiently and makes the data clear and clear.
1. Create
Click on the top toolbar table to draw a table on the canvas

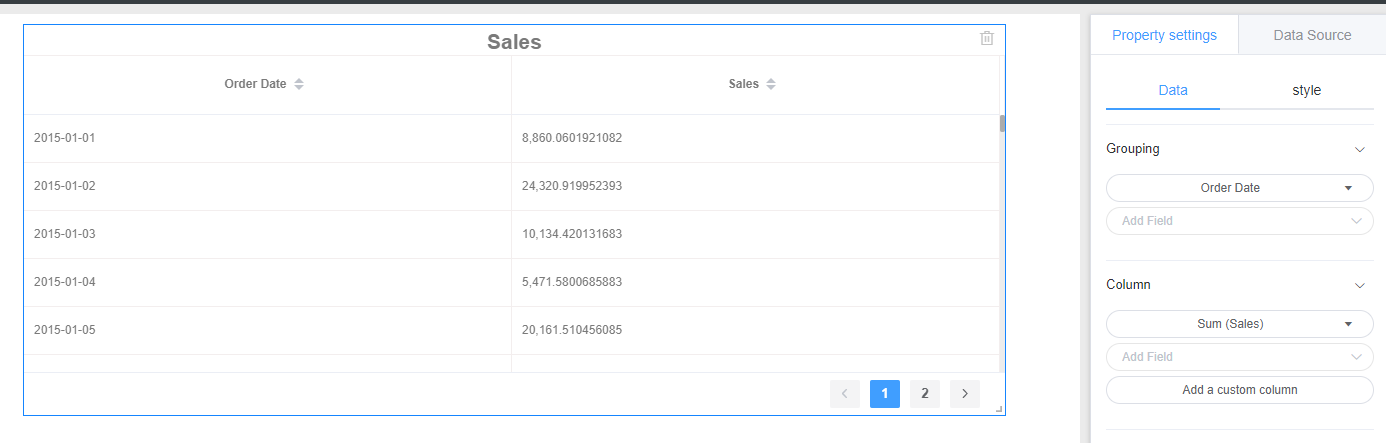
2. Data settings
1.Grouping
Grouping is to facilitate the statistics of a certain date or data under a certain category. Group statistics on dates or categories, such as: To see the daily sales, we need to group the dates.
2.Column
Columns are every dimension we need to count, such as sales, visits, etc.
Packet and set the reference column line graph data is provided an X-axis and Y-axis is provided.
3.Custom column
See: Custom Columns
3. Style settings
Table styles are divided into: background, title, header, cell, display settings
Background, title set reference line graph style setting the corresponding module.
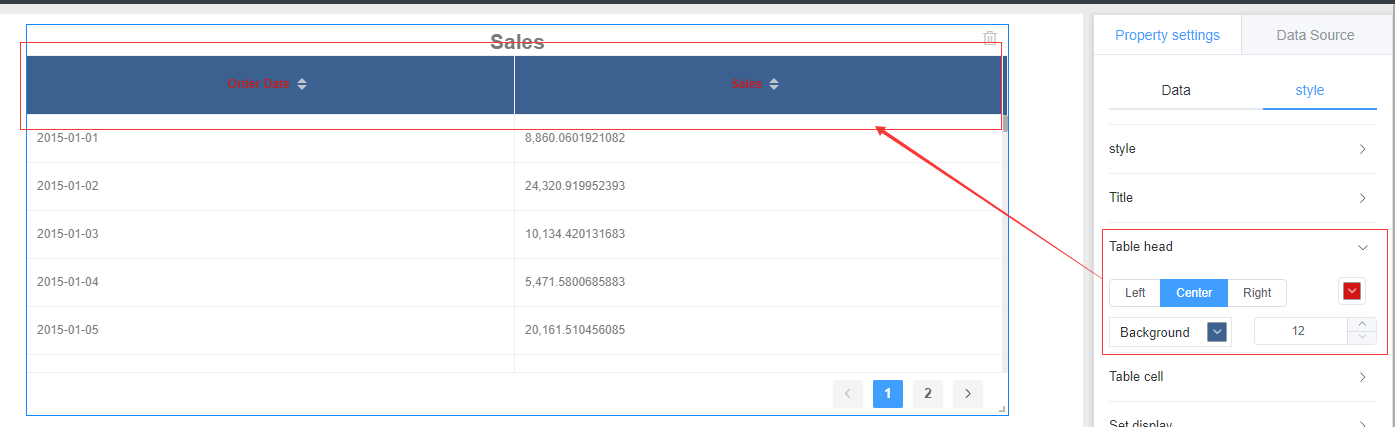
1、 Table header
The position of the head of the header configuration table, font color, font size, background color, etc.
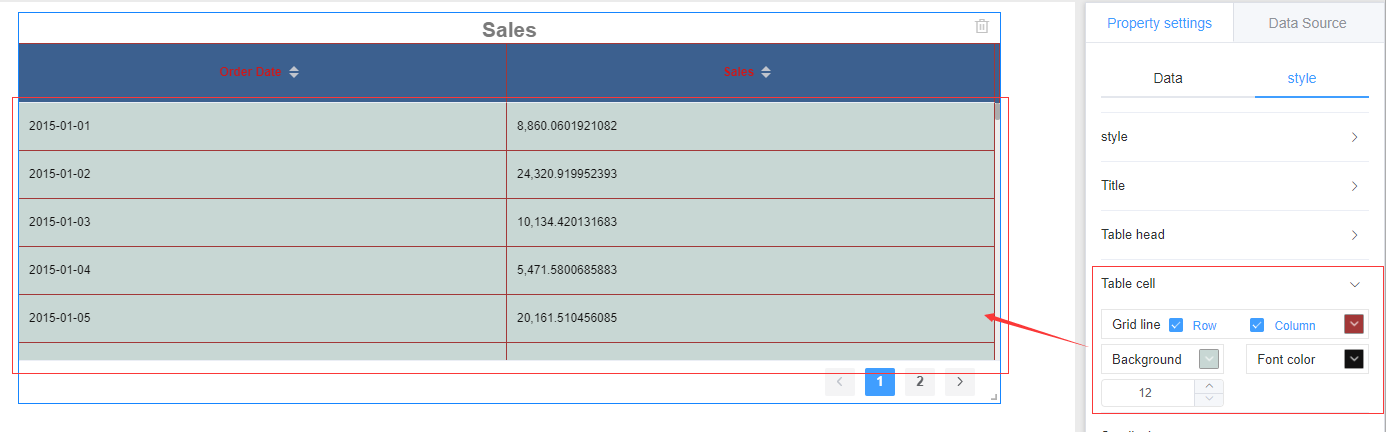
2、Table call
The main part of the cell configuration table, grid lines, background, fonts, etc.
3、highly adaptive
Turn on height adaptive, the height of the table is not limited to the specific setting height, will be determined by the amount of data returned each time.
4. Location and size
Referring line chart setting position and size