Report configuration
In this chapter, we'll detail how to configure a report page that contains line charts, tables, and dashboards.
1. Create a dashboard
1. First, we click on Chart -> Dashboard, add a dashboard component, and drag the dashboard to the appropriate location and size.
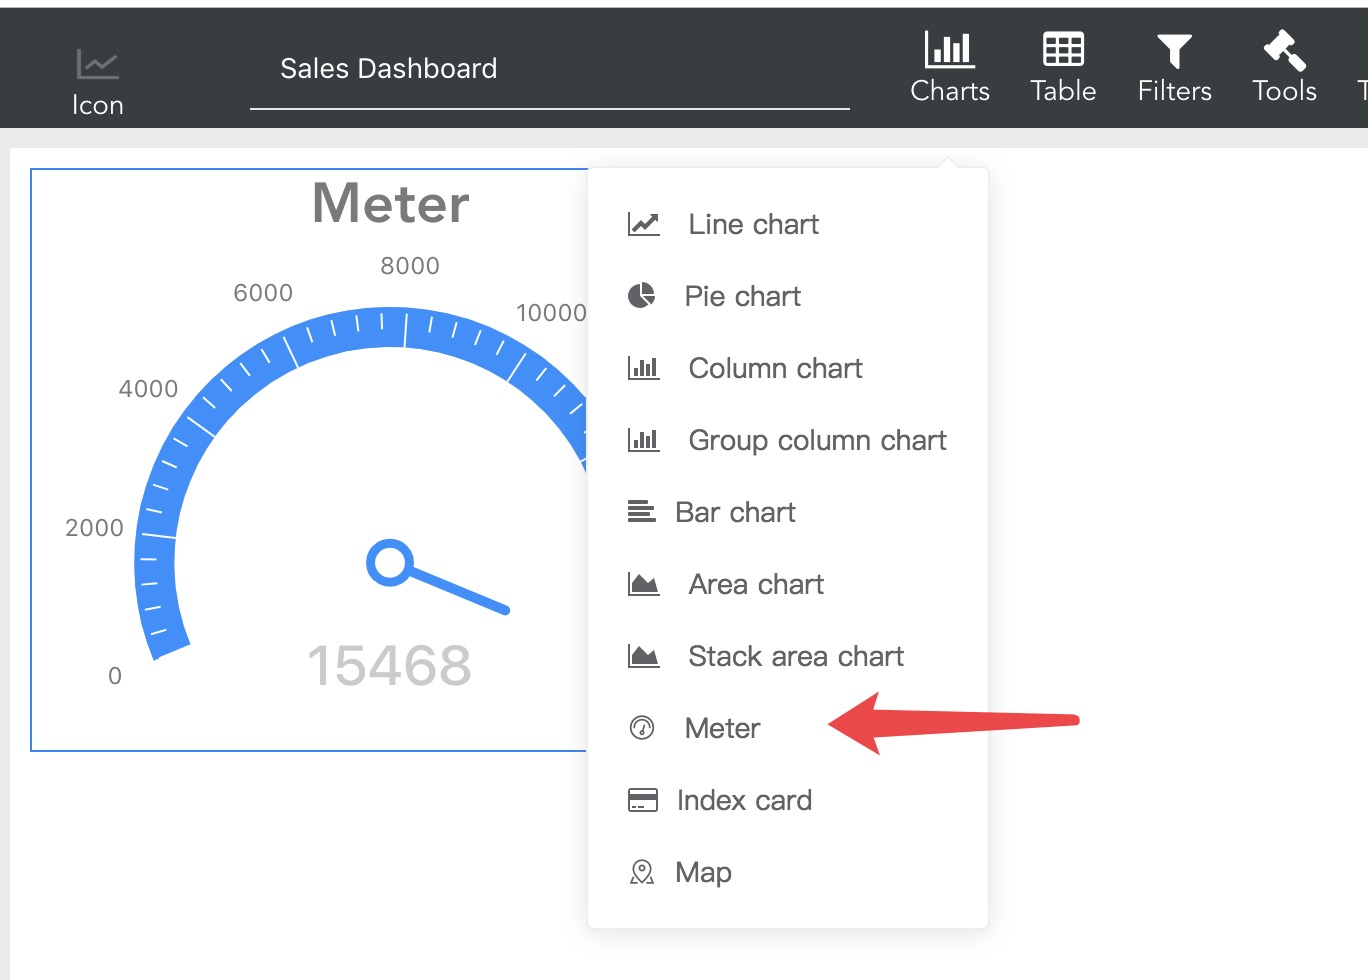
The default dashboard data is test data, we can leave it alone
2. Configure the data source
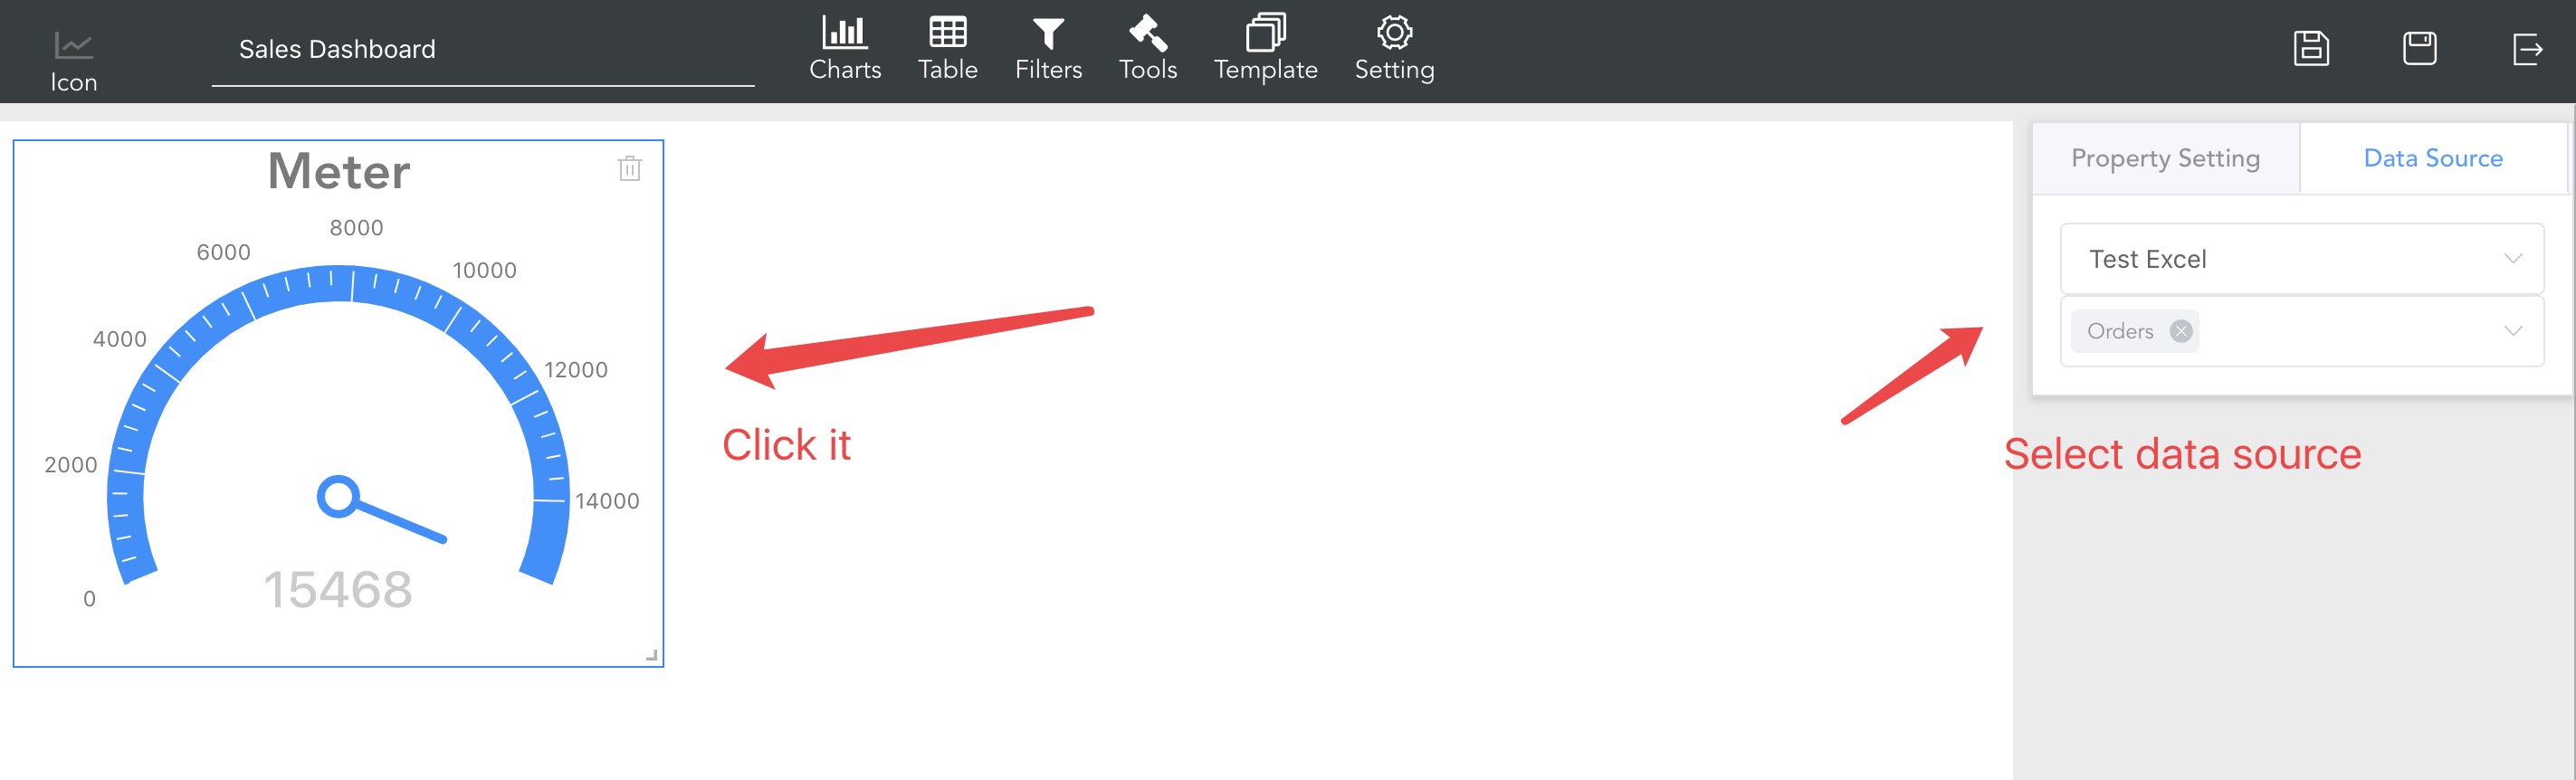
If you set up the data source in the page configuration from the beginning, then the data source of the page will be used by default here.
You can also select other data sources, click on the meter component -> click on the right data source, select the data source and table, as shown below
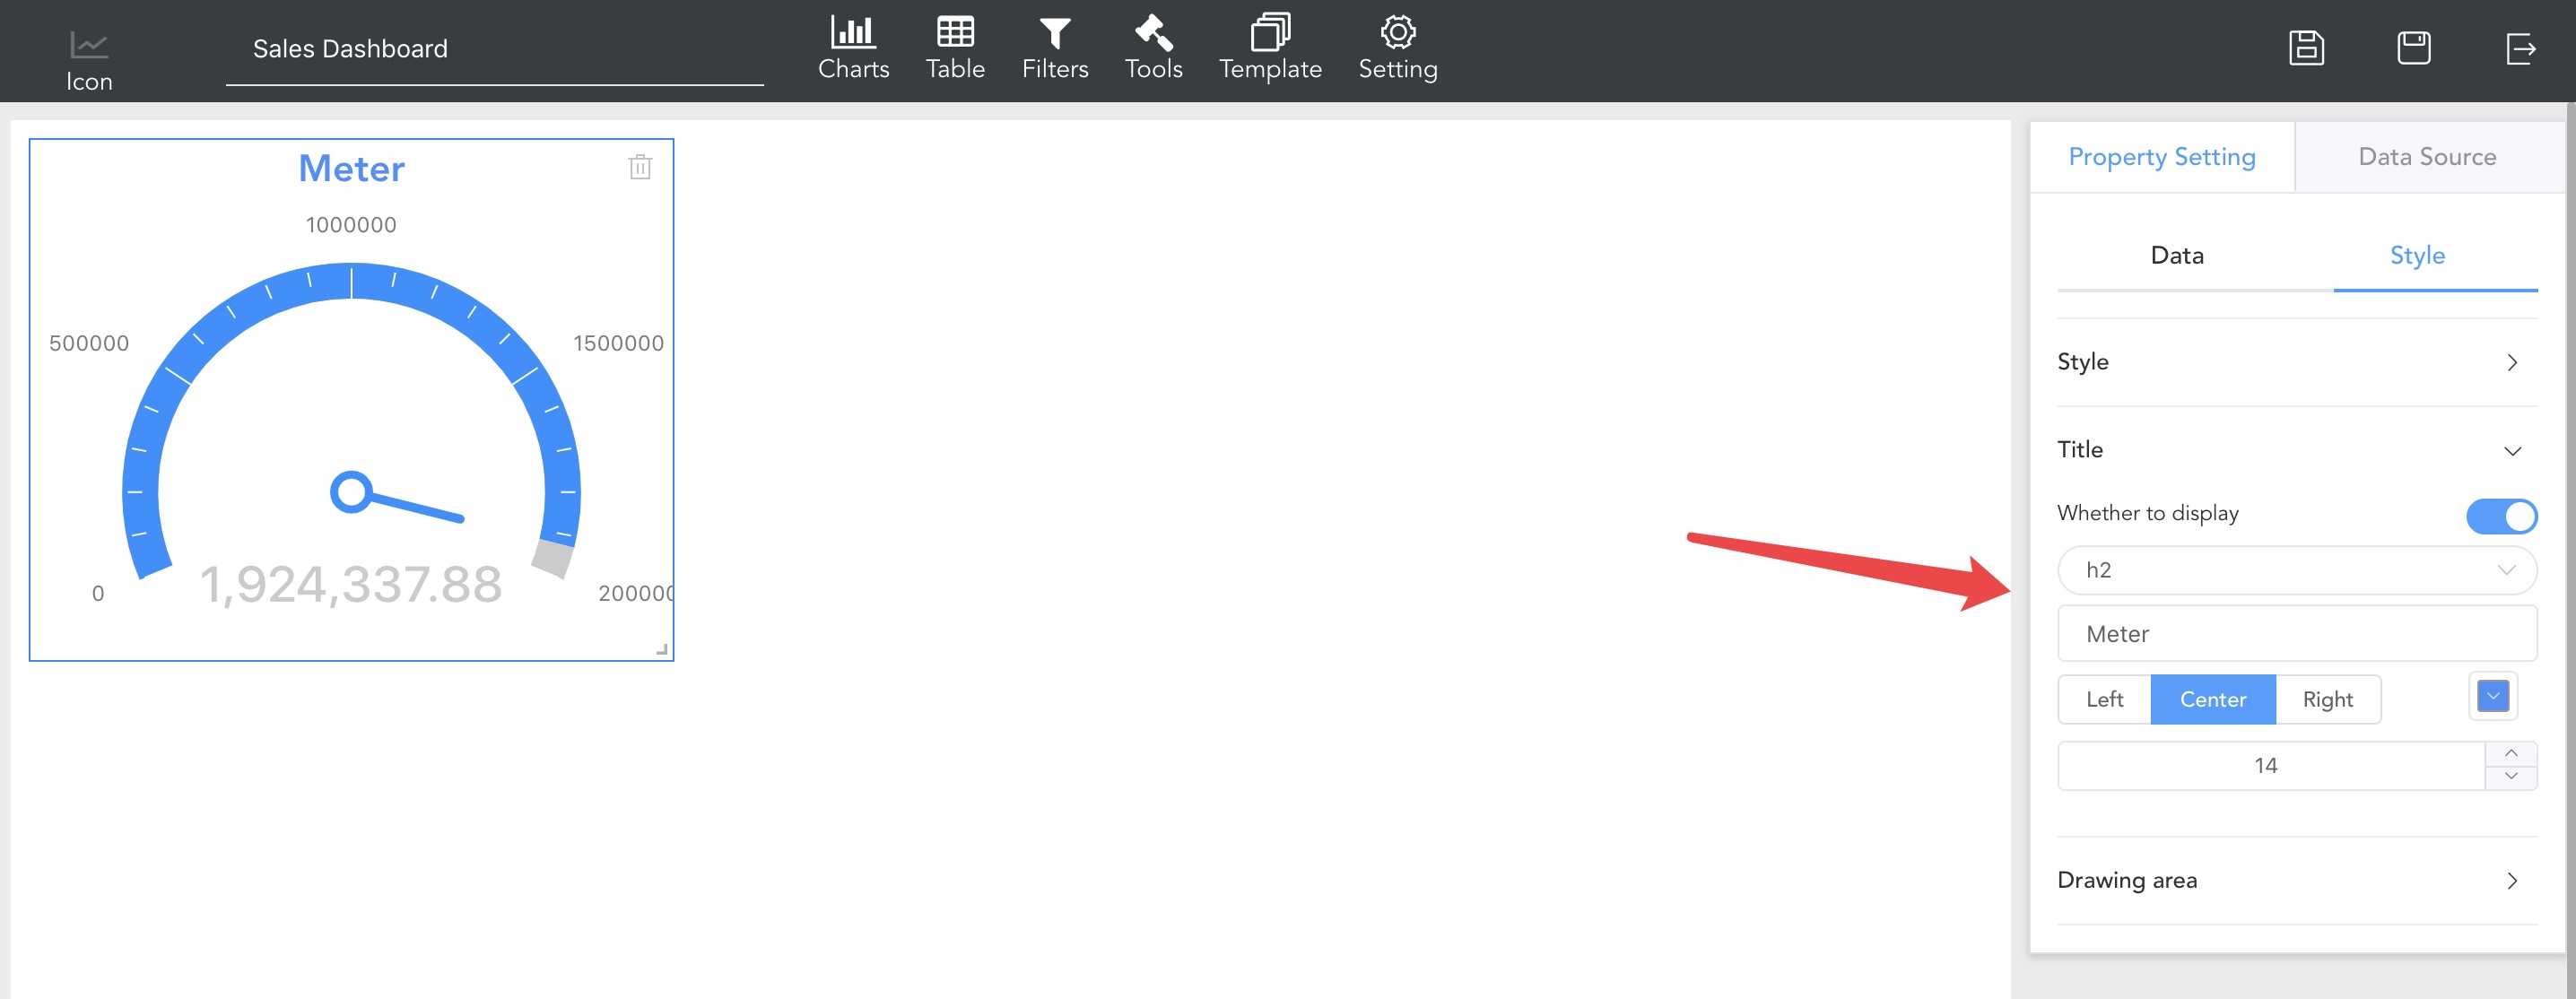
3. Property settings
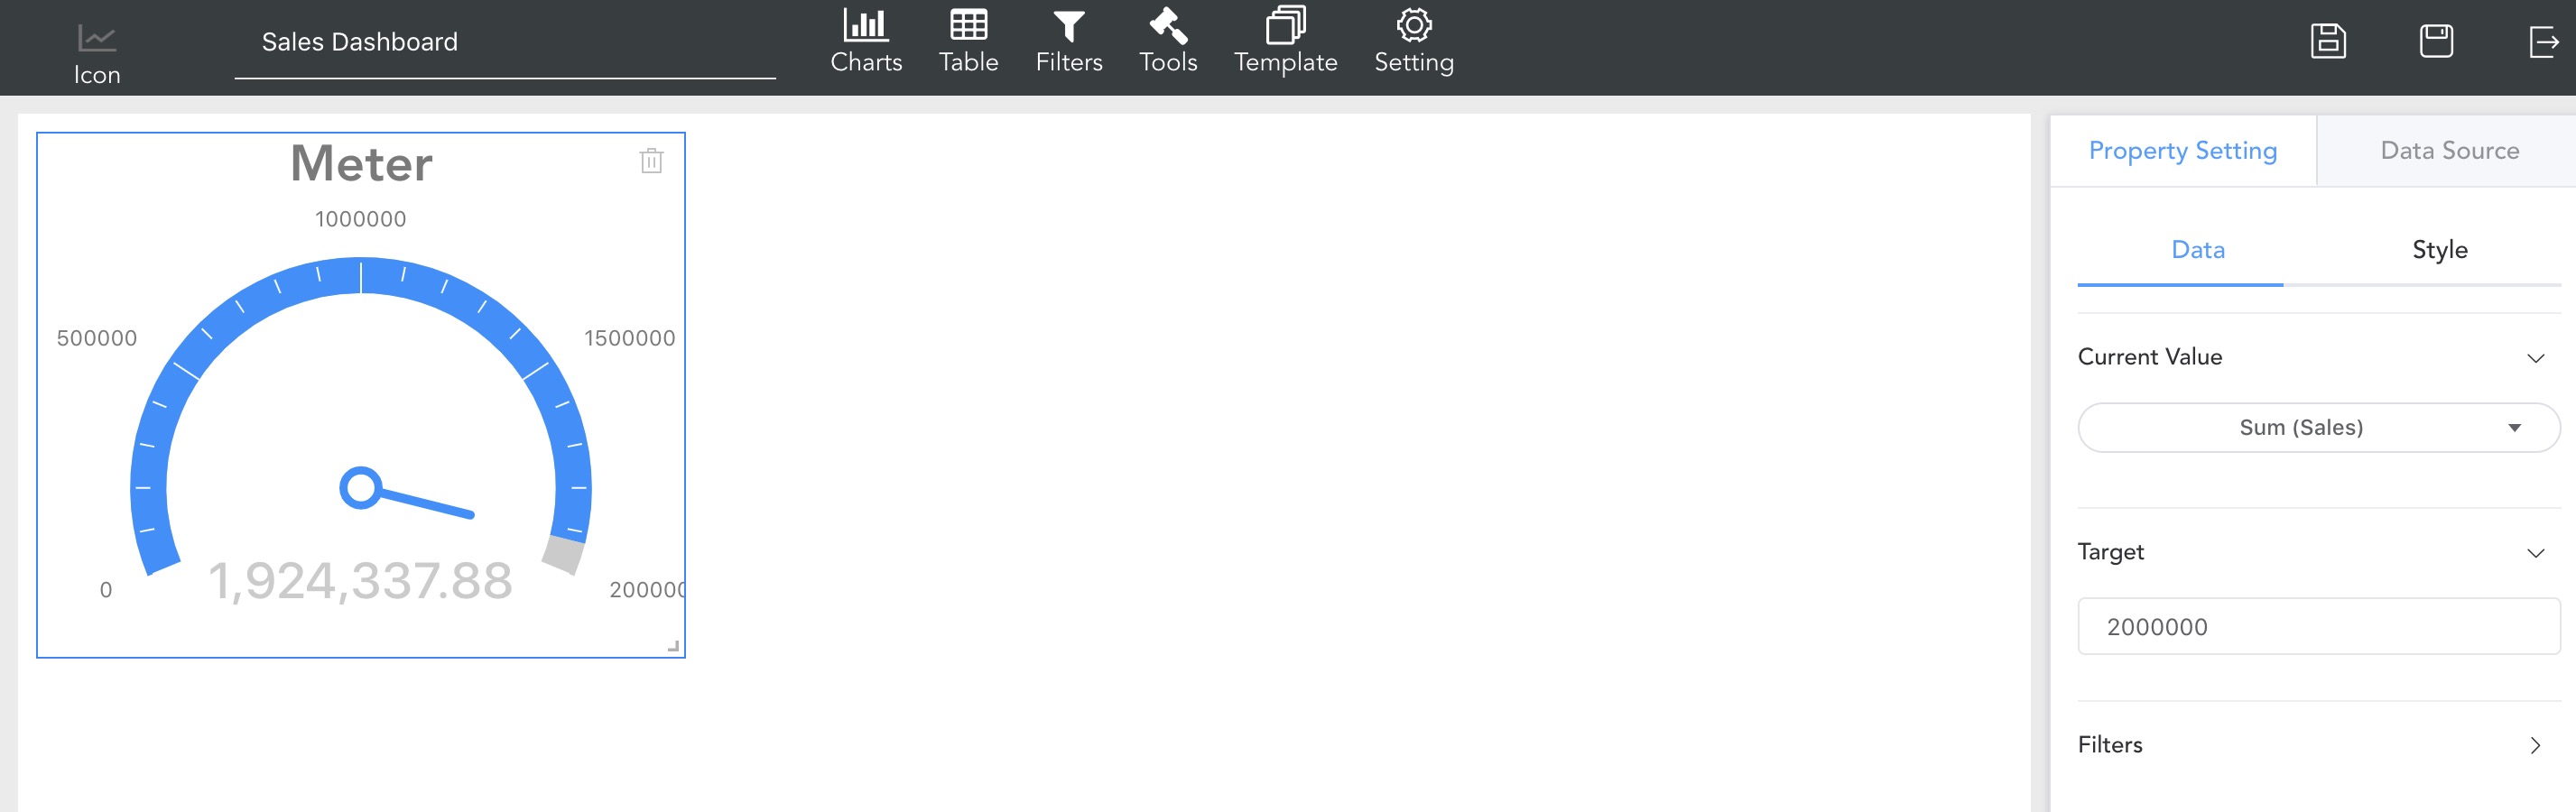
Here the data displayed on our dashboard is the total sales, so the current value here we set the sum of the sales. The target value is two million. As shown in the figure, we have configured the dashboard, is it very simple?
4. Style settings
After the data is configured, we click on the style to style the dashboard.
We changed the title to "Total Sales" and set the title to the appropriate font size and color, as shown below
For more information on the configuration of the dashboard, please refer to the dashboard section.
2. Create a line chart
Click on Chart -> Line Chart, add a line chart component, and drag to the appropriate position and size.
2. Property settings
We want to see a line chart of sales and profits for each day. On the X-axis, we choose Order Date, and the Y-axis sums sales and profits. as the picture shows
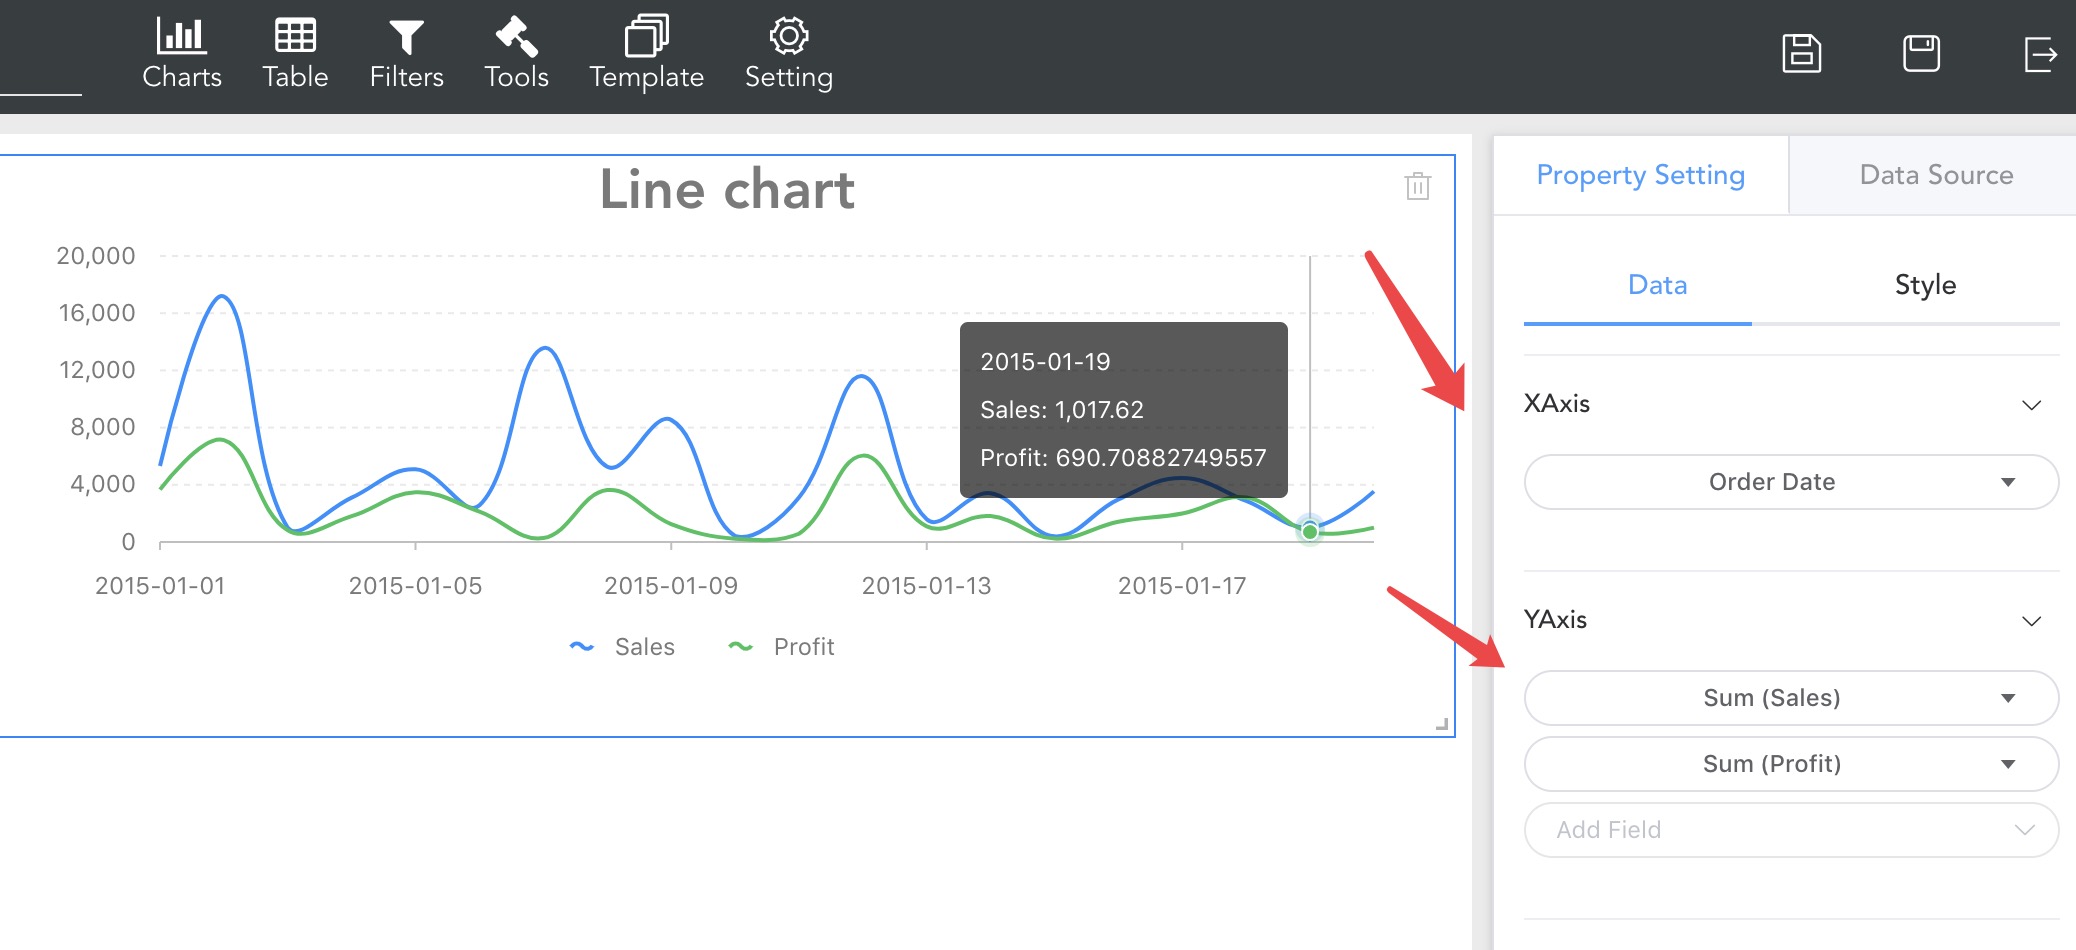
A simple line chart is configured. For more line chart configuration, please refer to the line chart section.
3. Create a table
1. Click on the table to add a table component and drag it to the appropriate location and size
2. Property settings
In the table, we want to see the sales, orders, and profit information for each day, as shown below.
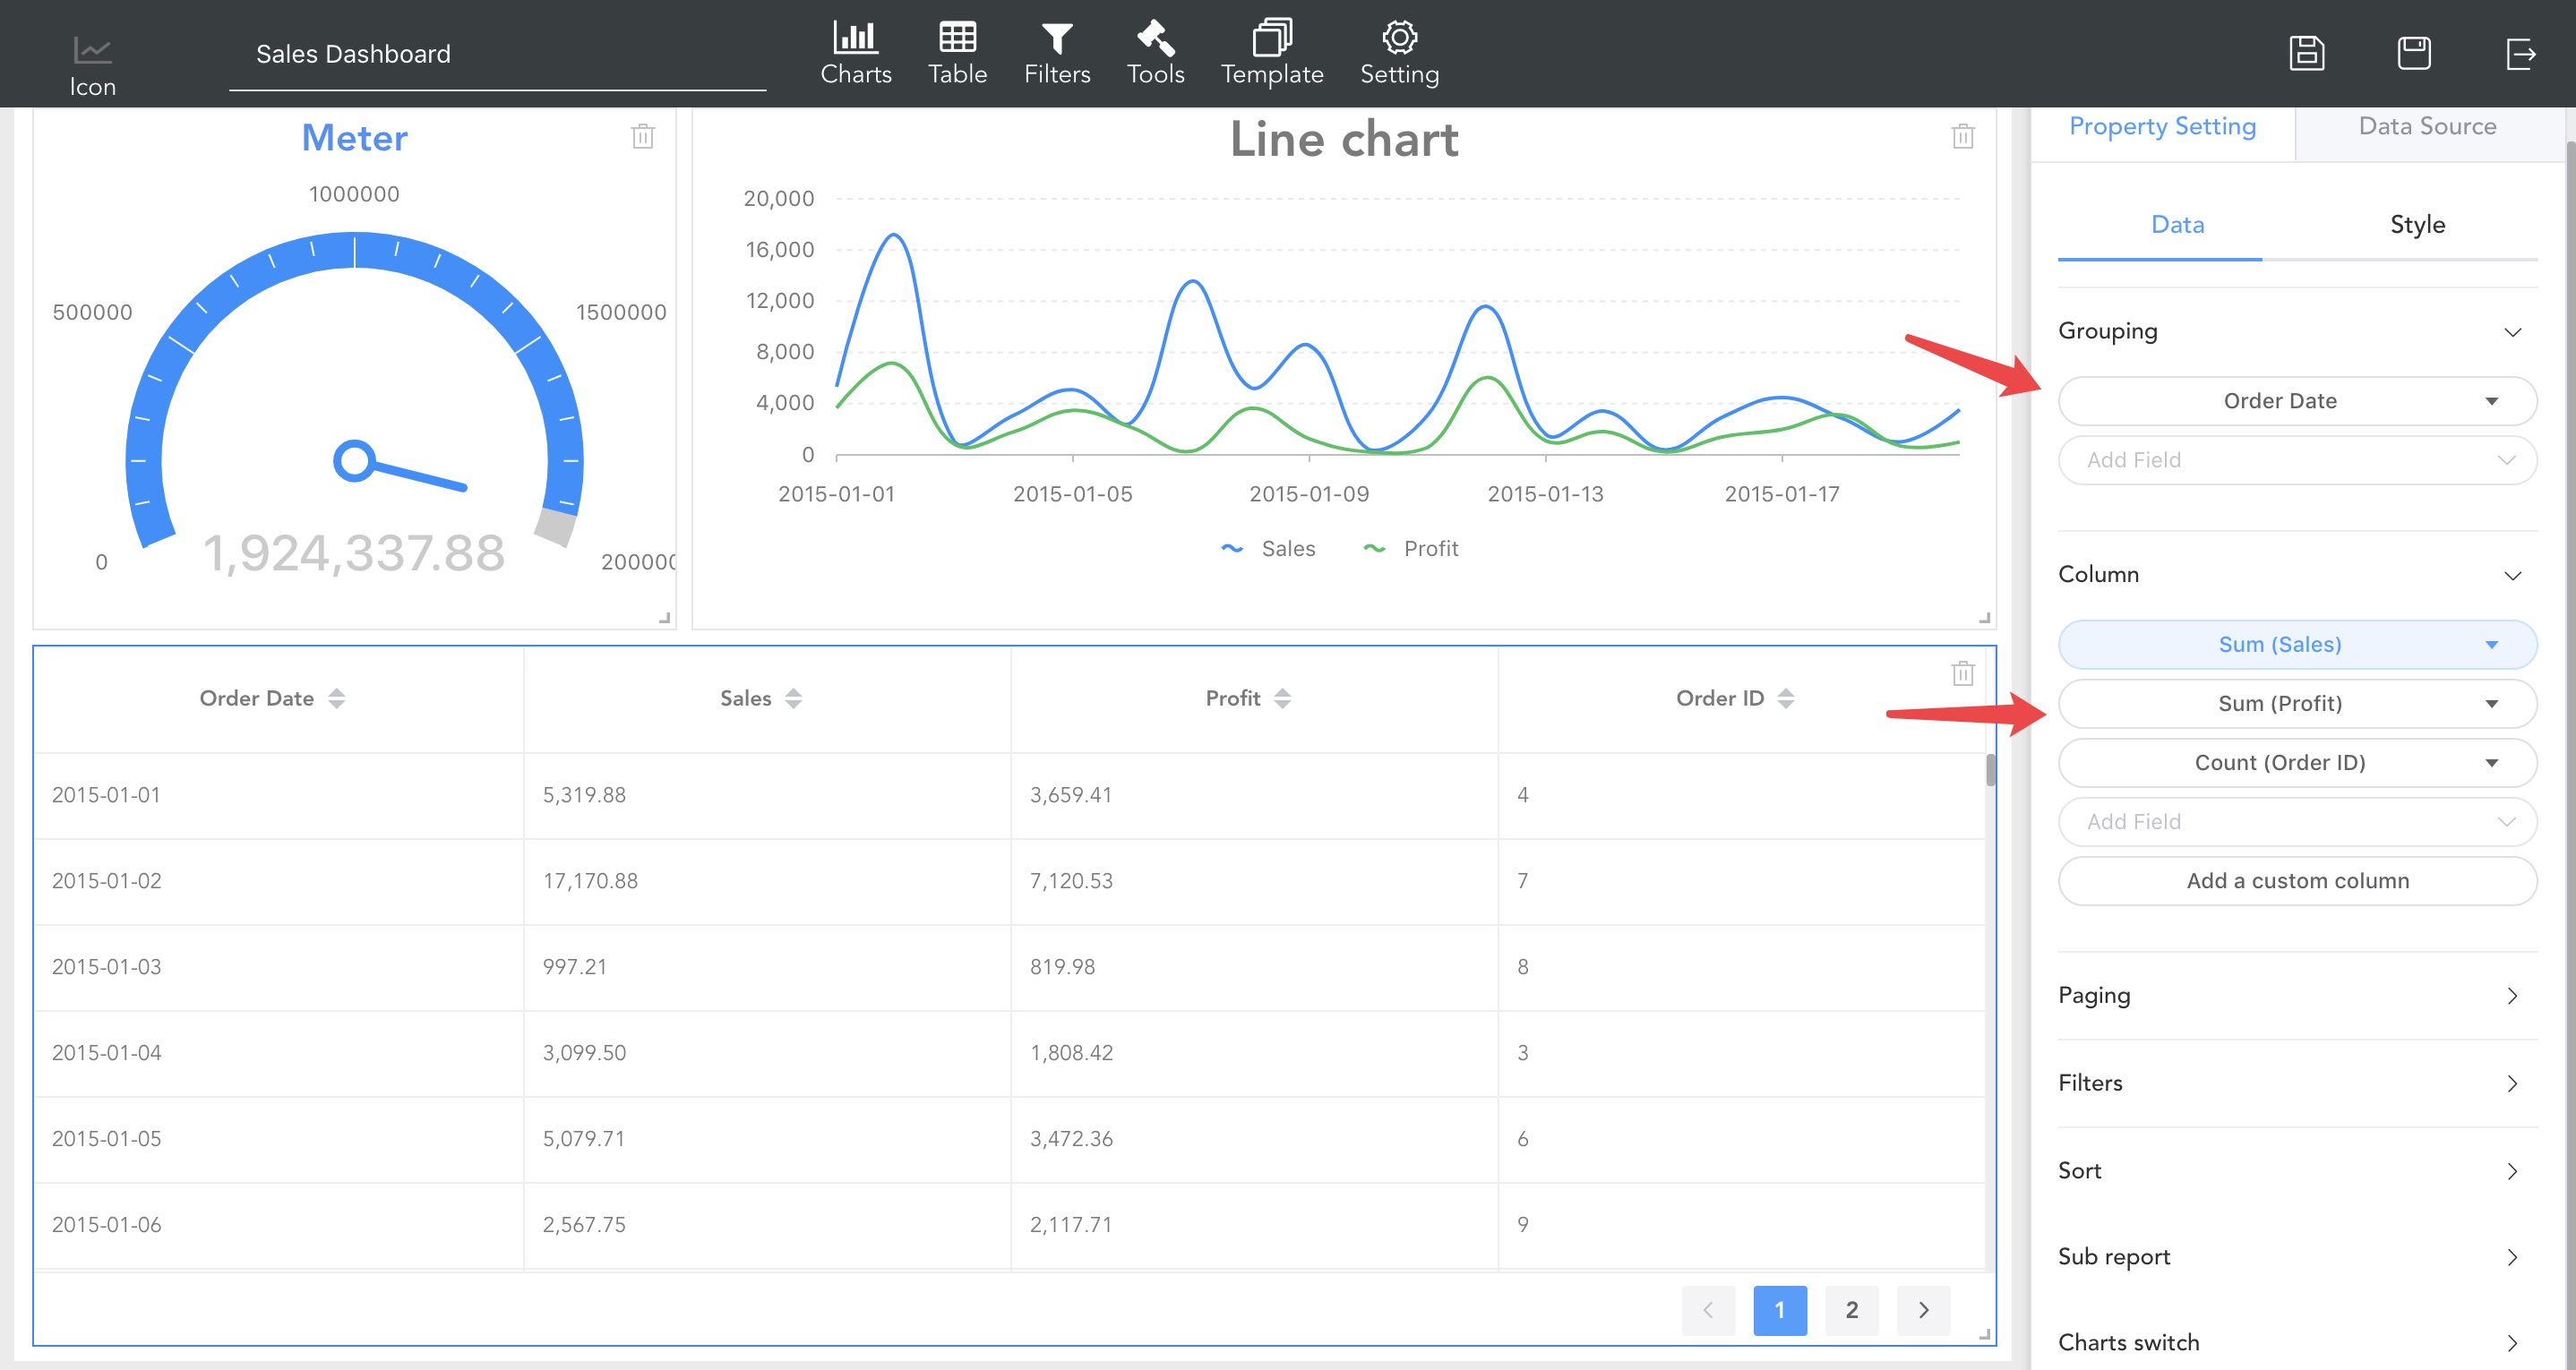
Here we group the order dates, sum the sales, profits, and the total number of orders.
Next, we rename the queue, click on the relevant column -> select to modify the display name, as shown below
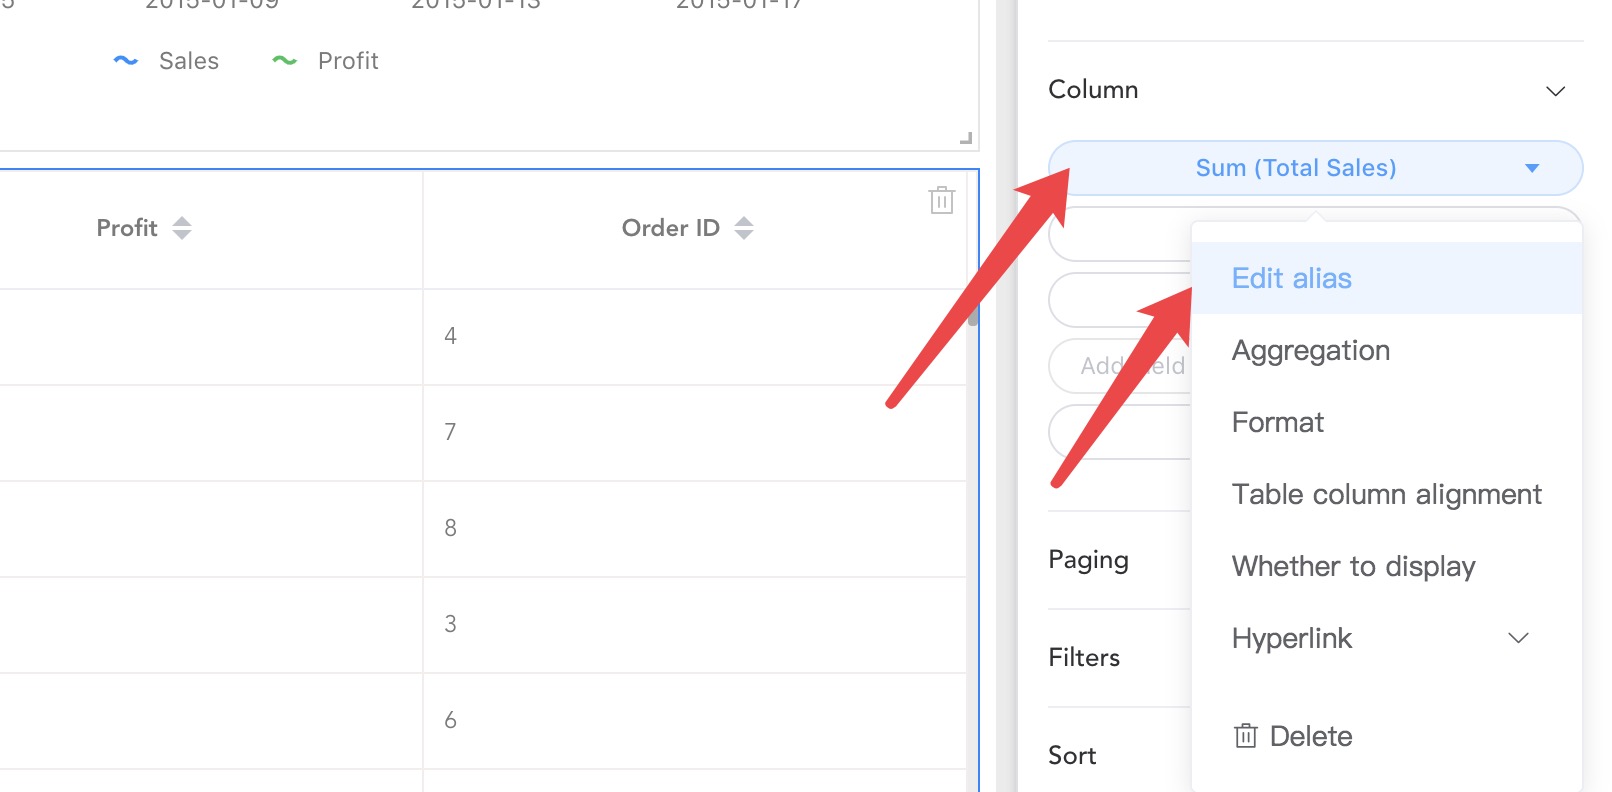
For more table configuration please refer to the table section
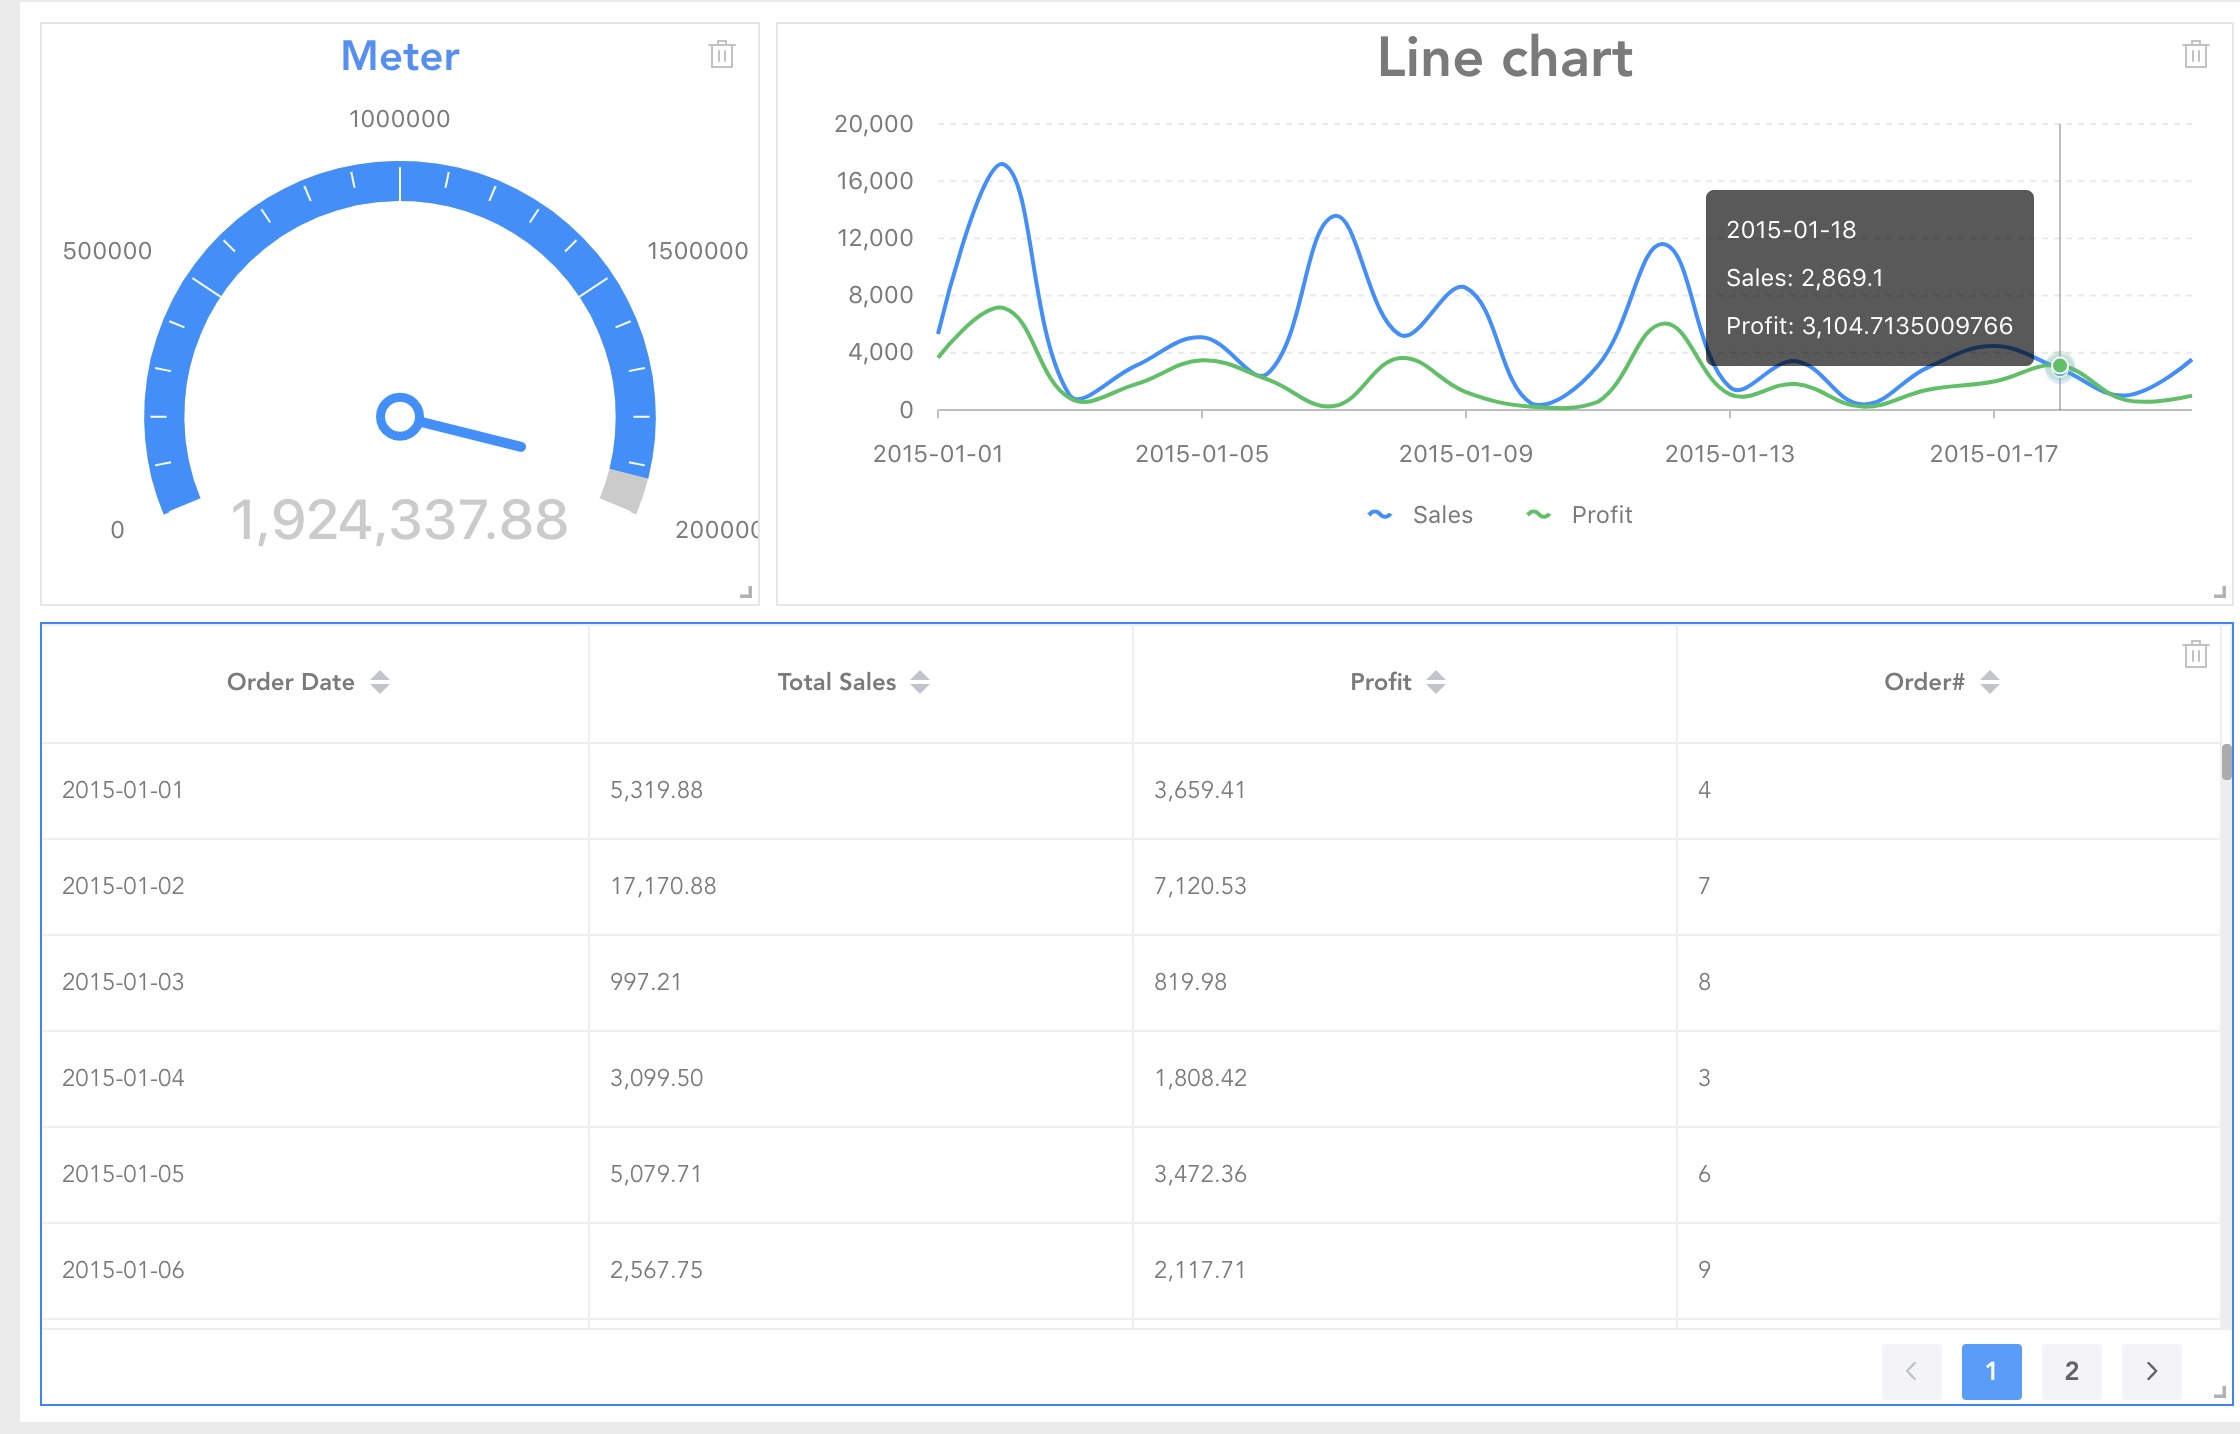
The last report page containing the dashboard, line chart, and form is configured. Don't forget to save it.