Grouped histogram
A grouped histogram can show more dimensional data than an underlying histogram.
1. Create
Click on Chart -> Group column chart to draw a grouped histogram on the canvas.
2. Data settings
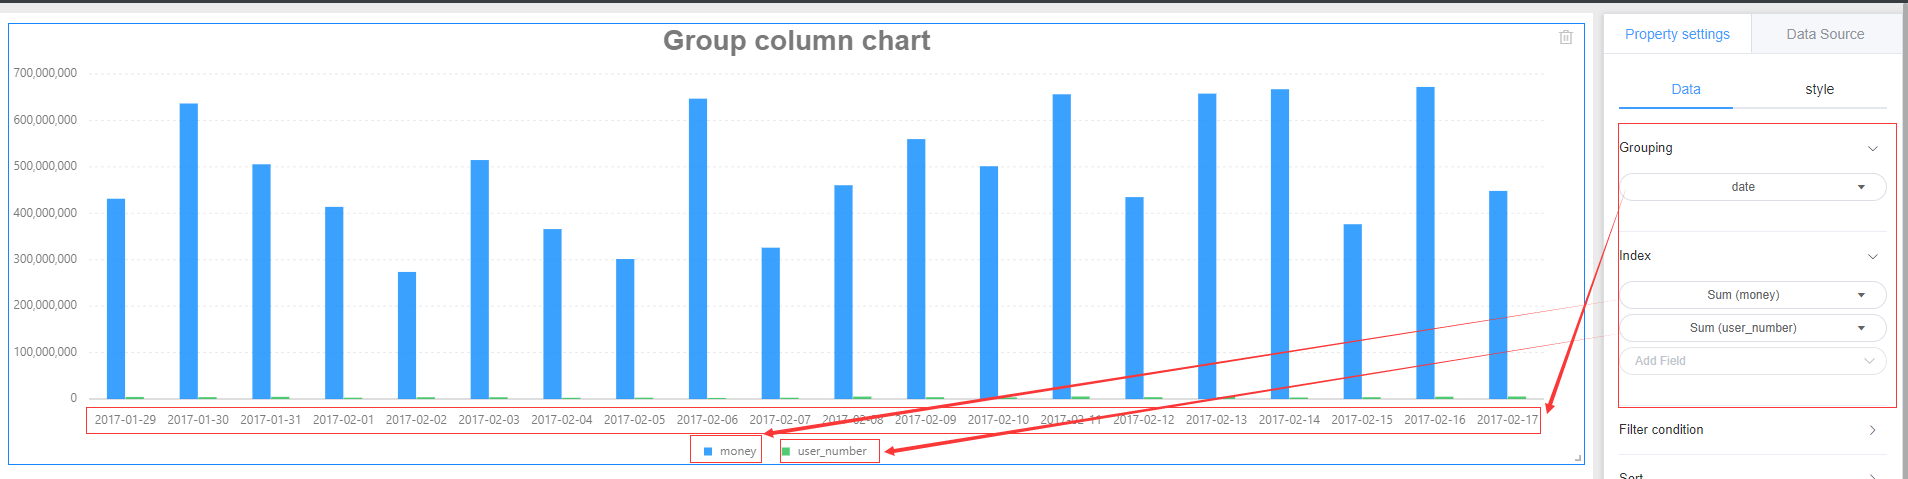
Grouped histogram involves two parameters: grouping and metrics
1. Display the values of different indicators under the same group
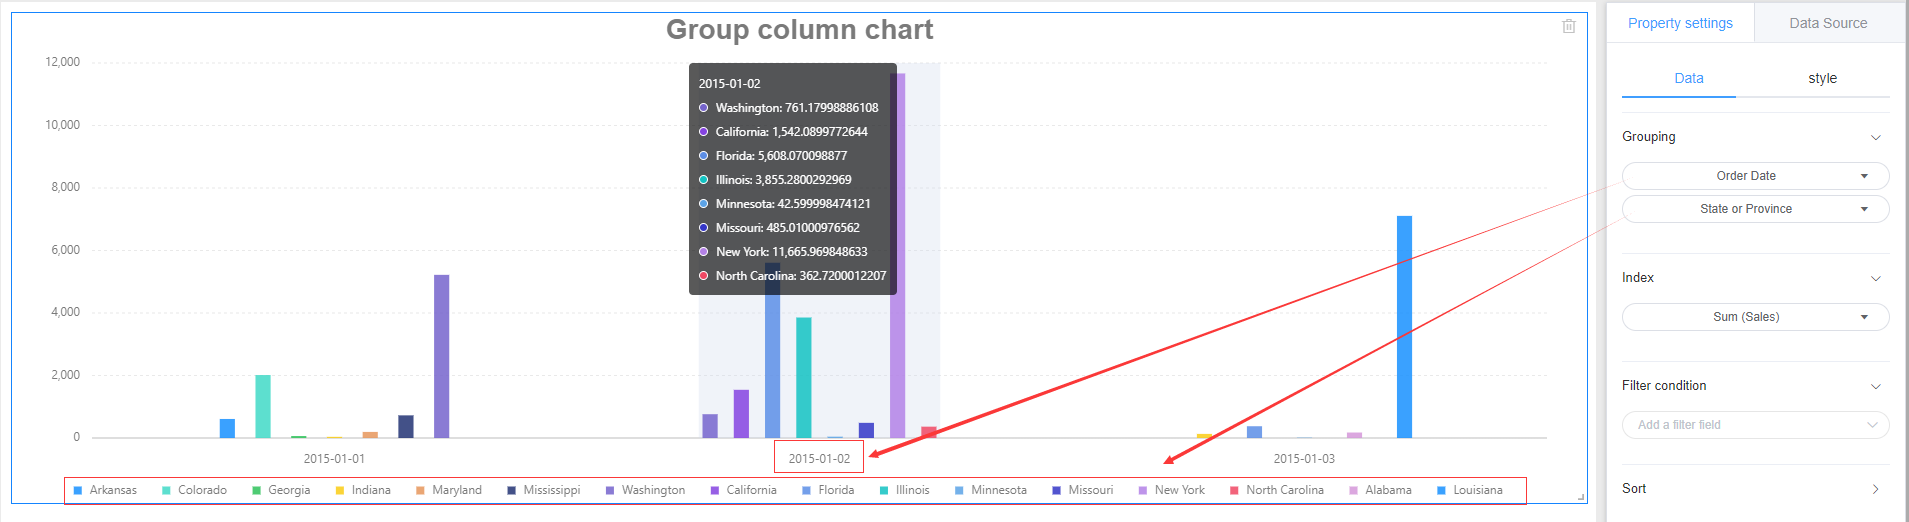
2.Display the values of the same indicator under two groups
3. Style settings
The grouped histogram style is divided into three parts: background, title, and drawing area.
Referring specifically set line graph style setting the corresponding module.
4. Location and size
Referring line chart setting position and size