Stacked area chart
Stacked area chart. Like the basic area map, the only difference is that the starting point of each data set on the graph is different. The starting point is based on the previous data set. It is used to display the trend line of the size of each value as a function of time or category. Partial relationship with the whole.
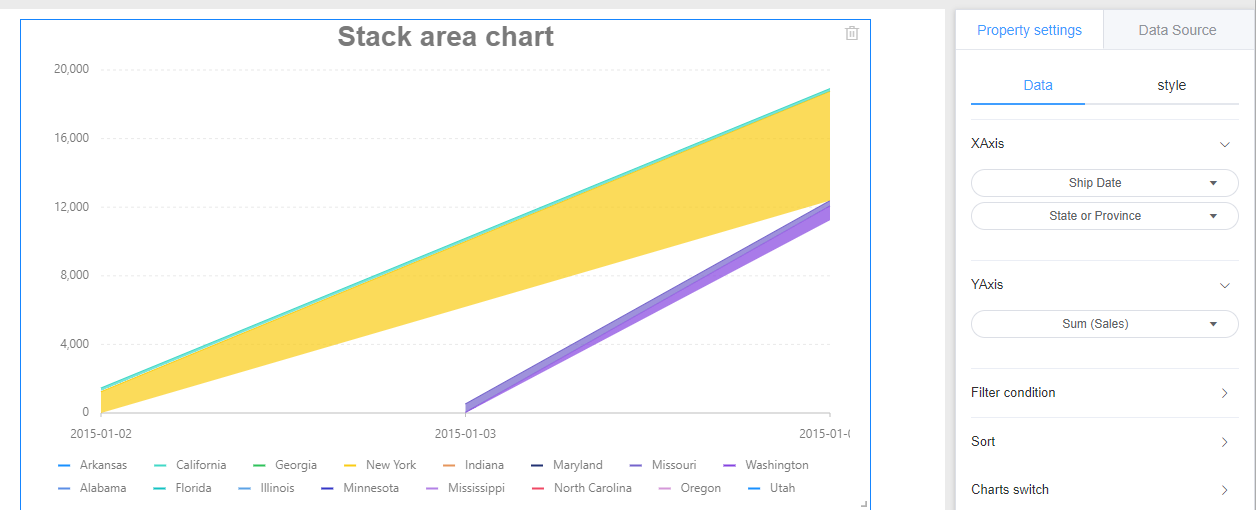
1. Create
Click on charts -> stack area chart to draw a stack area map on the canvas.
2. Data settings
Referring line chart data provided
3. Style settings
The Stacked area chart style is divided into three parts: background, title, and drawing area.
Referring specifically set line graph style setting the corresponding module.
4. Location and size
Referring line chart setting position and size