Meter
A meter is a quasi-materialized chart with scales representing metrics, pointers representing dimensions, and pointer angles representing values. Visually show the progress or actual situation of an indicator.
1. Create
Click on Charts -> Meter and draw the dashboard on the canvas.
2. Data settings
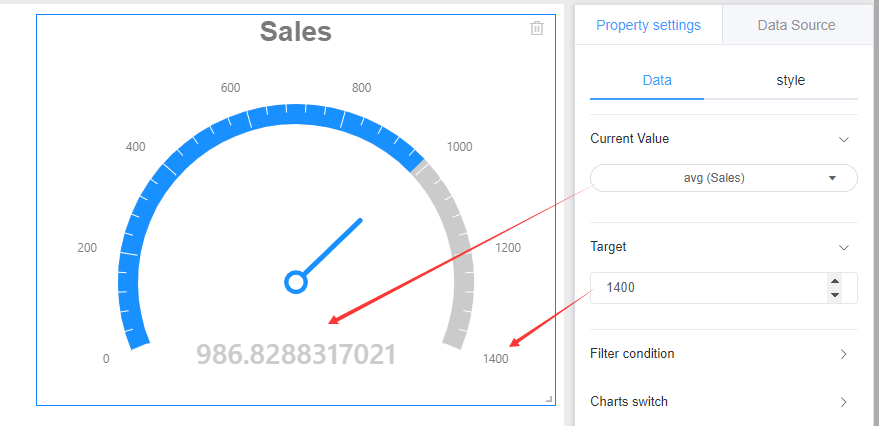
The Meter involves two parameters: the current value and the target value. The current value is the value of the dimension you selected; the target value is the value you want the selected dimension to reach and needs to be entered manually.
3. Style settings
The Meter style is divided into three parts: background, title, and drawing area.
Referring specifically set line graph style setting the corresponding module.
4. Location and size
Referring line chart setting position and size